This year, leading supply chain intelligence platform SONAR has shipped new features that surface insights to its users faster than ever before, aggregating relevant data into new dashboards, adding a layer of AI analysis that quickly explains the significance of data series, and integrating with data partners to provide critical information at specific points in user workflows. SONAR also released an iOS app, Blue to Blue, to help carriers stay running in the optimal lanes for their business.
The top 10 enhancements introduced this year demonstrate a broad shift towards smarter, more integrated logistics management. From real-time monitoring to predictive analytics, each feature is designed to equip users with actionable insights.
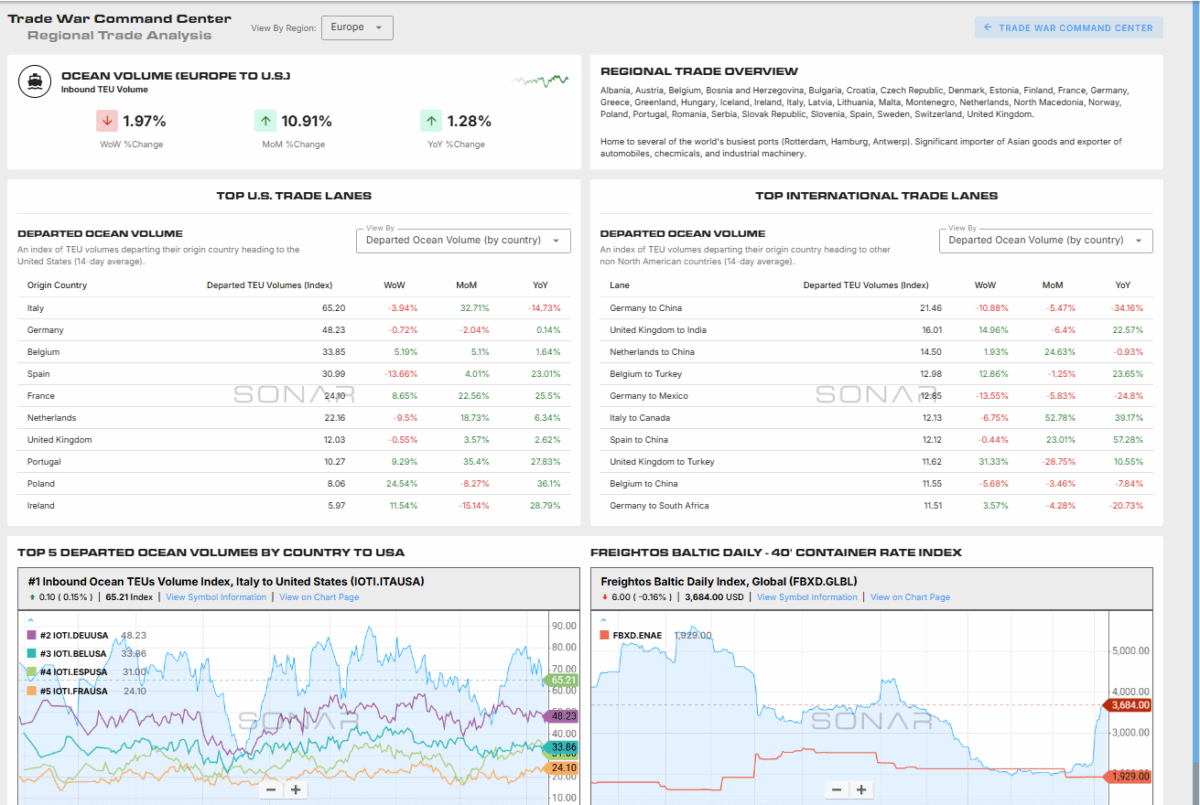
The Trade War Command Center takes the top spot with its comprehensive transparency on tariff changes, trade routes, and commodity flows. Designed for businesses navigating cross-border freight challenges, it provides dynamic visualizations of market disruptions and their potential supply chain impacts. This tool’s inclusion of data sets like Ocean TEU bookings and U.S. Customs imports positions it as essential in strategic decision-making processes for global trade.
Next is the Broker Tool Kit, which combines Coverage Guide, Sales Guide, and Rate Intelligence in a single streamlined platform. Brokers can now efficiently assess market volatility and identify key lanes to optimize resources. This integration aids in maximizing profit margins by providing insightful lane-level data tailored to market conditions, a significant asset in the ever-changing freight landscape.
The Magic Link CASS data share in Supply Chain Intelligence (SCI) introduces a revolutionary way for companies to integrate and share critical supply chain data securely and efficiently. This integration brings deeper insights from Cass Information Systems users, allowing them to bypass traditional data-sharing barriers, ensuring that sensitive information is distributed in a more controlled and user-friendly manner. With one secure click, users gain a unified view of spend, volume, and performance across their transportation network. This removes all of the work of importing data for SONAR customers and lets you spend time on analysis and action to improve your network
The Find Capacity feature enhances the SCI framework by offering unprecedented insights into carrier availability across lanes through a partnership with GenLogs, allowing SONAR to suggest carriers already operating in a user’s network. This feature simplifies the task of finding reliable carrier capacity in a volatile market.
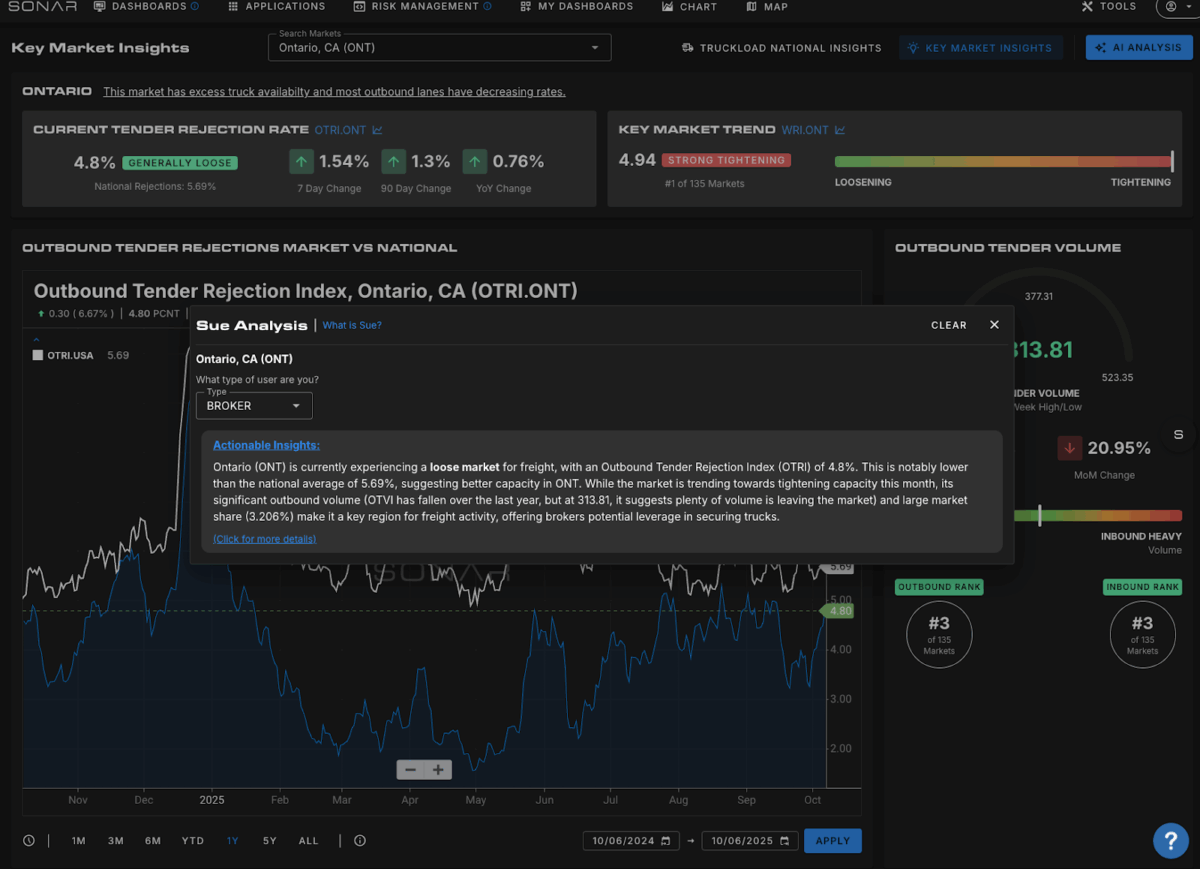
With the AI Analysis Layer in Key Market Insights, SONAR breaks new ground in data interpretation. This intelligent layer automatically generates reports on trend movements, potential regional disruptions, and strategic opportunities, essentially writing the story behind complex datasets. It’s a critical development for users needing foresight in rapidly shifting markets.
The latest Chart Enhancements extend the leading edge of freight data visualization. Users now can analyze lane-level trends, apply seasonality modes, and forecast conditions six months ahead. By integrating the Seasonally Adjusted Moving Average, businesses can more accurately anticipate market shifts, facilitating informed decisions.
SONAR’s Quick Rates Chrome Extension revolutionizes quick-access information. Offering immediate lane-level spot rates and market conditions within the browser, this tool is indispensable for professionals requiring real-time data without interrupting their workflow. It’s a seamless adaptation to the fast-paced demands of logistics operations.
The Blue to Blue iOS App brings SONAR’s capabilities to mobile devices, ensuring that logistics professionals, especially small carriers and drivers, have on-the-go access to crucial information like spot rates and freight trends. The app’s forthcoming lane-matching feature will enable users to target markets with high demand, aligning perfectly with carrier availability and rate optimization.
The Intermodal Dashboard and Contract Rates give intermodal commerce the focus it deserves. By providing an overview of rail performance coupled with intermodal contract pricing, this enhancement offers shippers and Intermodal Marketing Companies (IMCs) comprehensive cross-mode insights. It underlines a growing trend toward leveraging intermodal solutions for cost-effective transportation.
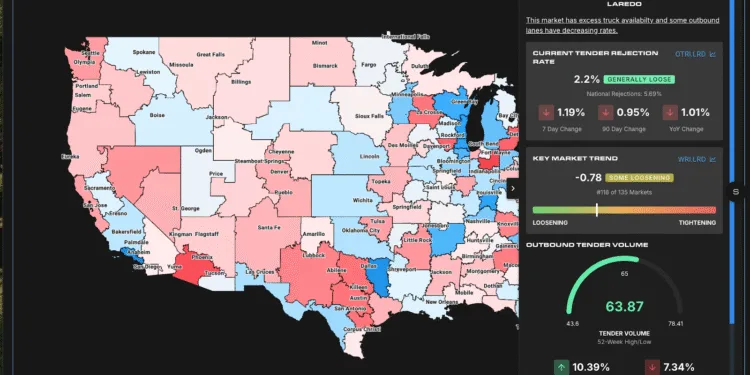
Finally, the Enhanced Maps Experience transforms geographical data interpretation. By integrating freight density visuals with real-time capacity and weather overlays, this feature allows users to pinpoint potential freight opportunities quickly. The resulting interface empowers users to make informed logistical decisions rapidly, enhancing operational efficiency.
Each enhancement aligns with SONAR’s commitment to delivering actionable, predictive freight data.
The post The top 10 features SONAR shipped this year appeared first on FreightWaves.


