
New SONAR Truckload Tender Dataset
SONAR IS releasing an updated and more comprehensive version of its Truckload Tender dataset. These metrics measure truckload demand, capacity, and lead times using electronic requests from shippers seeking capacity from their providers.
This new dataset:
- Is approximately twice the size of our original 2019 tender data
- Includes a more diverse shipper mix with stronger representation from refrigerated freight and Food & Beverage/CPG sectors
- Provides improved regional coverage and density across the U.S. and into select Canadian markets
- Continues with the same mission as OTVI, OTRI, OTLT, and OTMS, now with deeper market insight
Indices begin April 1, 2019 and use a national base index of 10,000 for volumes. Available at National, Regional, State, and Market levels.
New indices now available:
- SONAR Truckload Volume Index (STVI)
- SONAR Truckload Volume Index – Van (STVIV)
- SONAR Truckload Volume Index – Reefer (STVIR)
- SONAR Truckload Rejection Index (STRI)
- SONAR Truckload Rejection Index – Van(STRIV)
- SONAR Truckload Rejection Index – Reefer (STRIR)
- SONAR Truckload Rejection Index – Flatbed (STRIF)
- SONAR Tender Market Share (STMS)
- SONAR Tender Lead Time (STLT)
- SONAR Tender Lead Time – Van (STLTV)
- SONAR Tender Lead Time – Reefer (STLTR)
- SONAR Tender Lead Time – Flatbed (STLTF)
New SONAR data adds context to the weak freight volume story
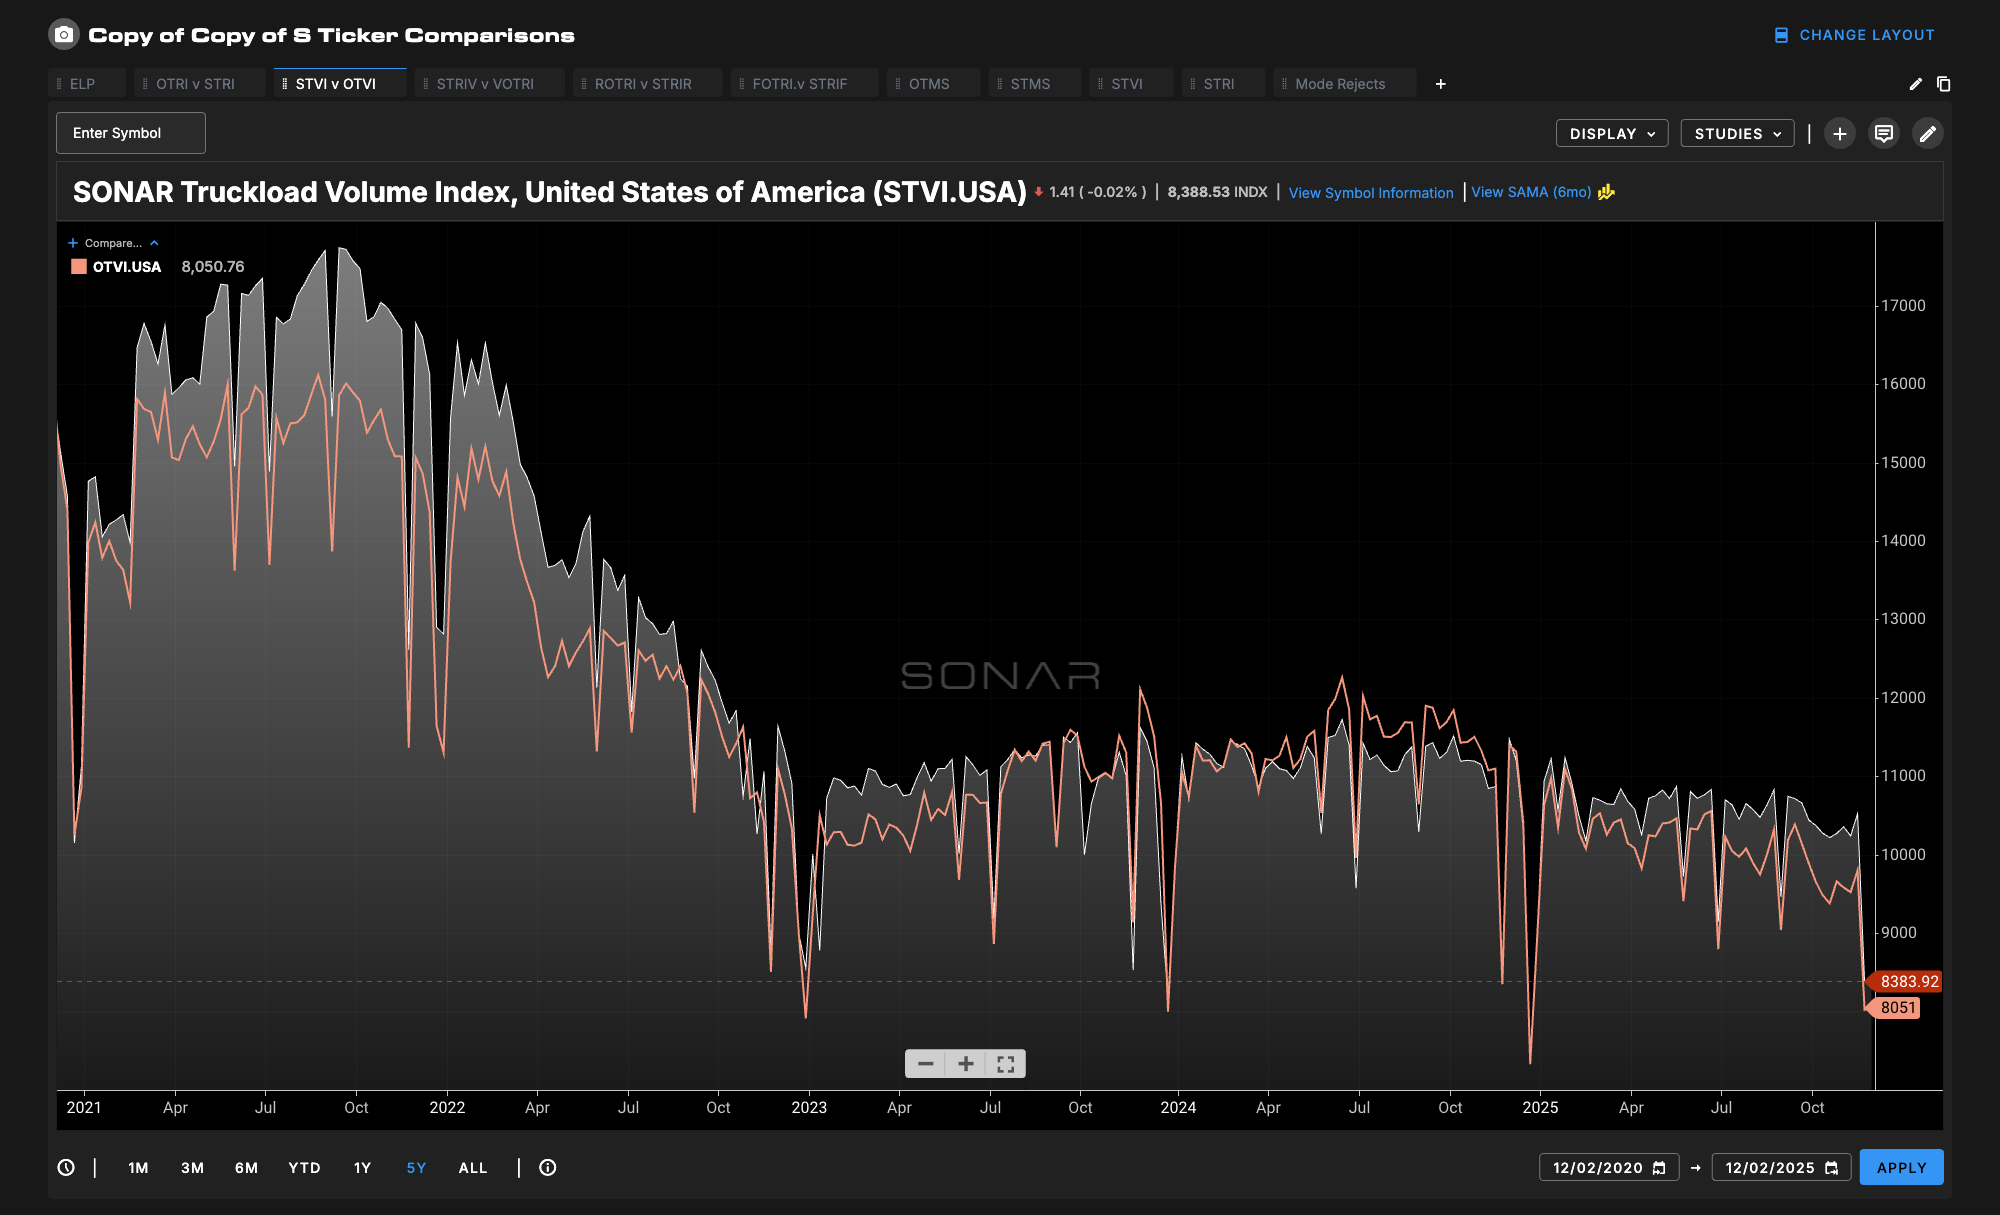
Despite a mini-pickup in tender volume in the past week, overall freight demand levels continue to disappoint. In prior reports, I have focused on the Outbound Tender Volume Index (OTVI), as a comprehensive measure of freight demand. In the past week, SONAR began publishing the SONAR Truckload Volume Index (STVI), which is also a measure of tender volume and includes both accepted and rejected tenders.
STVI is a dataset that is more heavily weighted toward consumer packaged goods, food, and shorter-haul traffic, which are relatively stable sectors of freight demand when compared to automotive and industrial. Therefore, the STVI may be a better representation of freight demand experienced by large truckload carriers that have the advantage of being more selective with the freight they choose to haul.
Both OTVI and STVI are useful indicators of overall freight demand, and directionally, they show the same thing – that freight demand is meaningfully lower year over year. The main difference is magnitude. OTVI and STVI are down 11% year over year and 3% year over year, respectively.
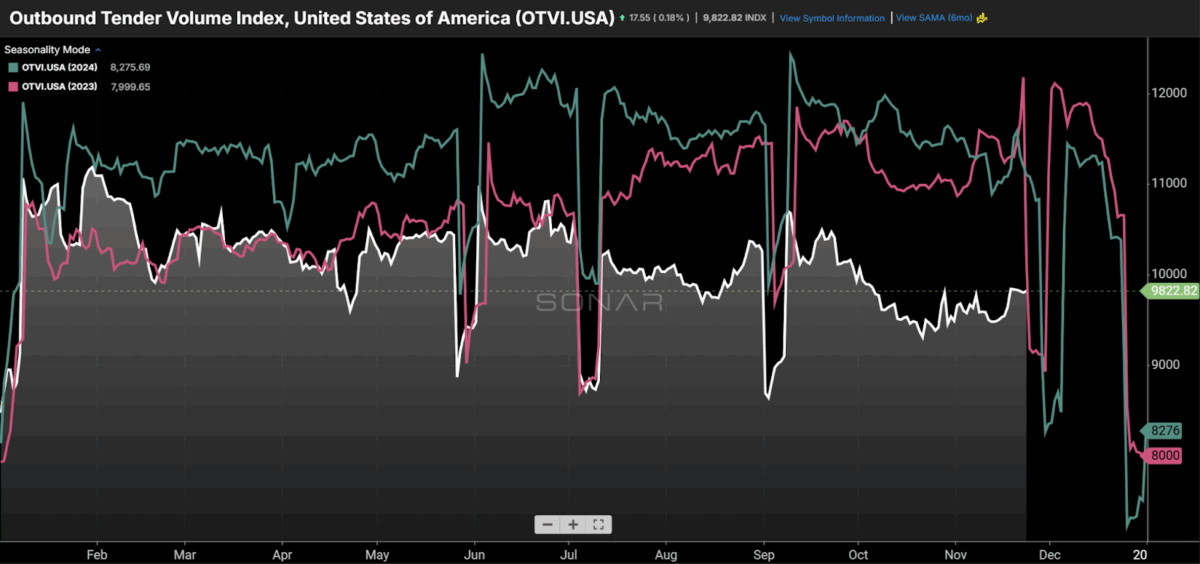
The Outbound Tender Volume Index, a comprehensive index of freight demand, is down 11% year over year. (Chart: SONAR)
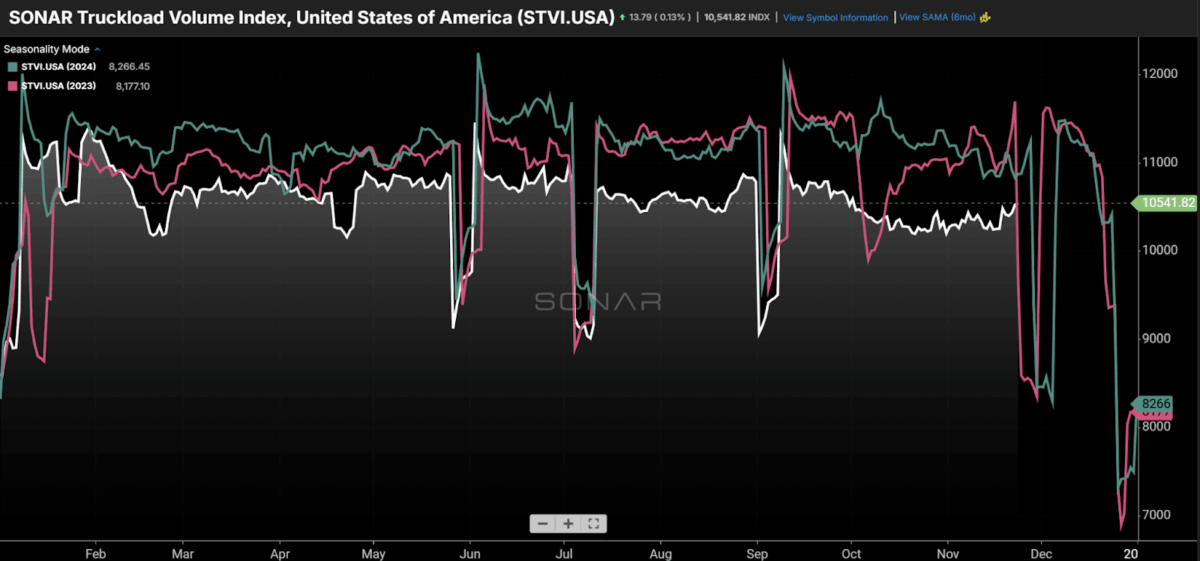
The SONAR Truckload Volume Index, which is more weighted toward relatively stable freight sectors, is down 3% year over year. (Chart: SONAR)
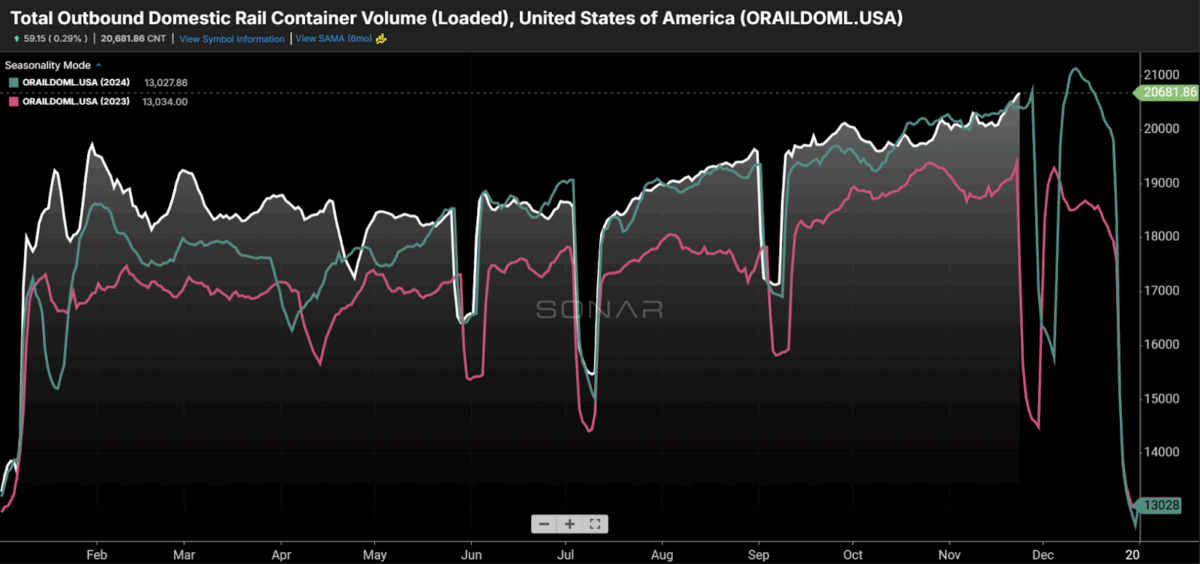
Containerized domestic rail intermodal (i.e., loaded 53’ containers) volume has experienced a meaningful fall peak season, similar to last year. (Chart: SONAR)
The new data also shows tender rejection rates that are a little better, from the carriers’ perspective
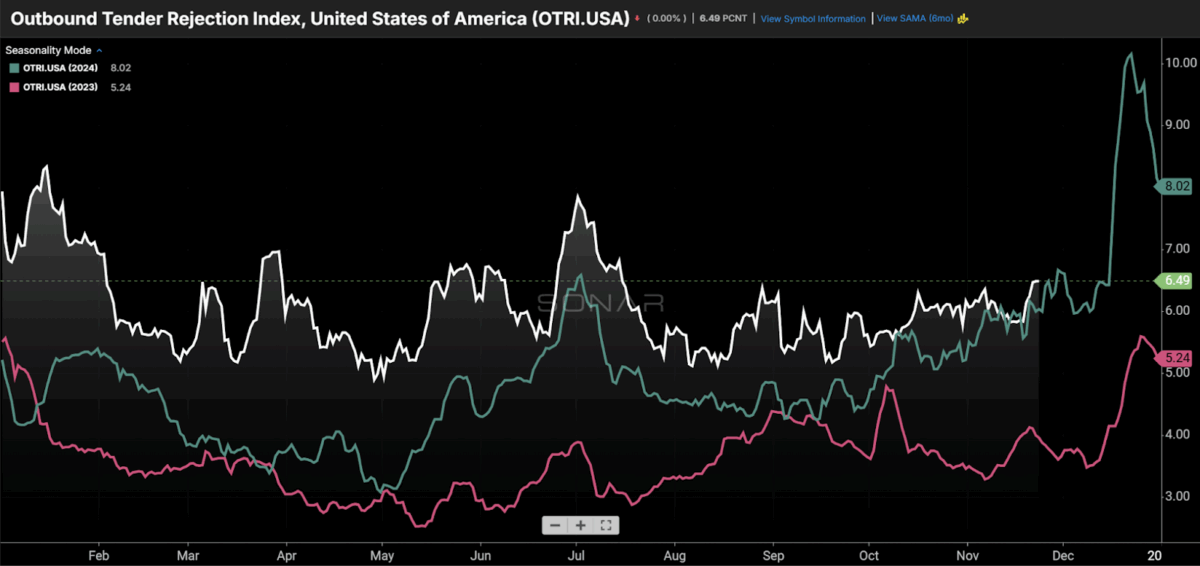
Using legacy data, the nationwide tender rejection rate currently stands at 6.49%, roughly in line with last year’s level. (Chart: SONAR)
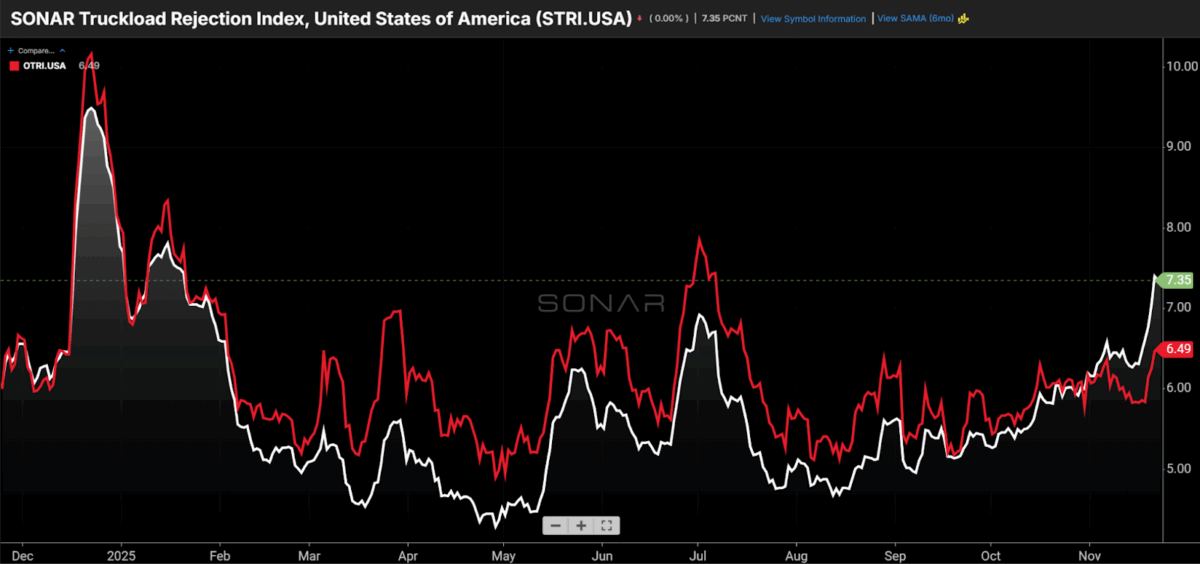
The SONAR Truckload Rejection Index (white line), the tender rejection rate for the STVI data described above, is currently 7.35%. (Chart: SONAR)
Tender rejection rates reflect the balance of supply and demand in the market, and tender rejection rates in the 6.5%-7.5% range suggest that the market, overall, is close to balanced. It remains to be seen whether rejection rates will spike in late November and December, like the past two years, and, if so, of what magnitude. Tender rejection rates have held up well when considering the sharp decline in tender volume (demand); that implies that a massive amount of capacity has left the market in the past year.
Using legacy data, the 6.49% overall tender rejection rate breaks down to 6.09%, 14.85%, and 13.51% for the dry van, reefer, and flatbed segments, respectively. So, participants in the reefer and flatbed sectors are experiencing a market that is much more favorable to carriers than those playing in the larger dry van sector.
Average spot rate tracking a little below year-ago levels
In last week’s report, I described how average spot rates took a step down in early November and were below 2024 for the comparable week for the first time since August. Since then, the average spot rate rose $0.02 per mile, as would be expected for this time of year. Seasonality suggests that capacity is coming out of the market temporarily around Thanksgiving. The holiday season should provide insight into what the freight market might look like next year, with further carrier exits and/or stabilization/improvement in freight demand.
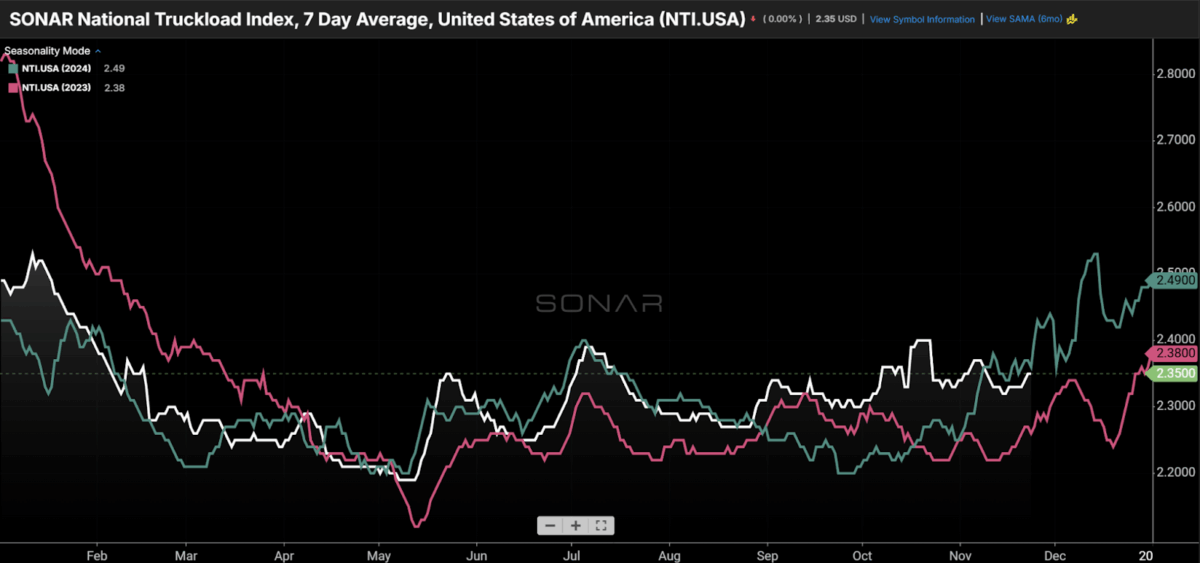
Average spot rates, displayed in the SONAR National Truckload Index (NTI.USA), are set to rise in the coming weeks, a period of seasonal tightness for trucking. (Chart: SONAR)
Diesel prices have been volatile, so it also makes sense to look at the average spot rate on a fuel-neutral basis, which is available via the NTIL.USA, as shown below.
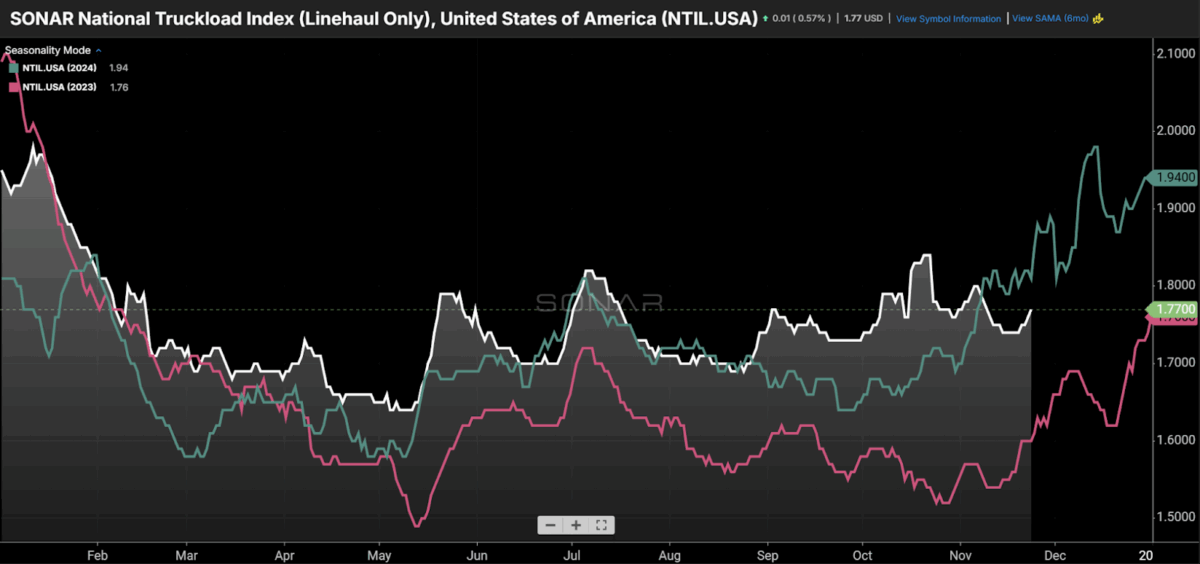
The average spot rates are a little further below year-ago levels when the impact of fuel is backed out. (Chart: SONAR)
Spot rates shot up at the beginning of October, driven by a step-up in the enforcement of immigration and cross-border issues (English language proficiency, non-domiciled drivers, cabotage). Now, the average spot rate is $0.05 off its high and $0.05 above where it started in October. The implication is that there was widespread fear of enforcement/over-enforcement, of labor laws at the beginning of October, and some of that fear has dissipated, leading some drivers to return to the market.
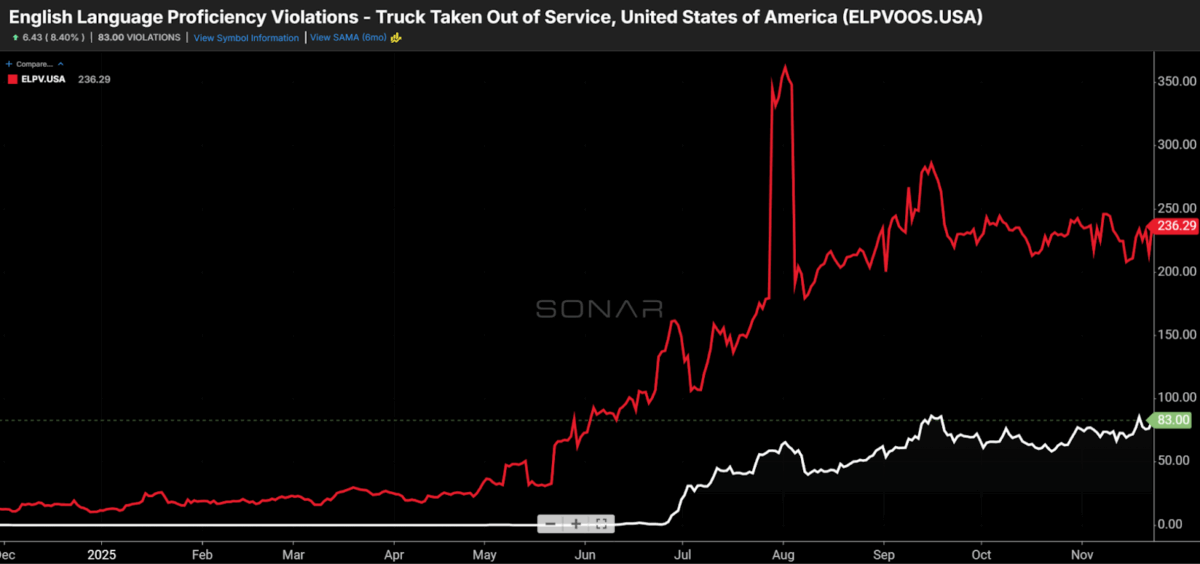
The chart above shows two data sets that are new to SONAR – the volume of English language proficiency violations (red) and how often those violations result in out-of-service orders (white). English Language Proficiency laws started being enforced in the second quarter, and enforcement accelerated in the third and fourth quarters. The spike in spot rates in October followed the surge in ELP violations and associated out-of-work orders in September. (Chart: SONAR)
The new tender datasets are now live. If you have questions, please contact your SONAR Account Manager or [email protected] to learn more or request a demo here.
The post SONAR releases new tender data, SONAR Truckload Volume Index (STVI) and SONAR Truckload Rejection Index (STRI) appeared first on FreightWaves.


