
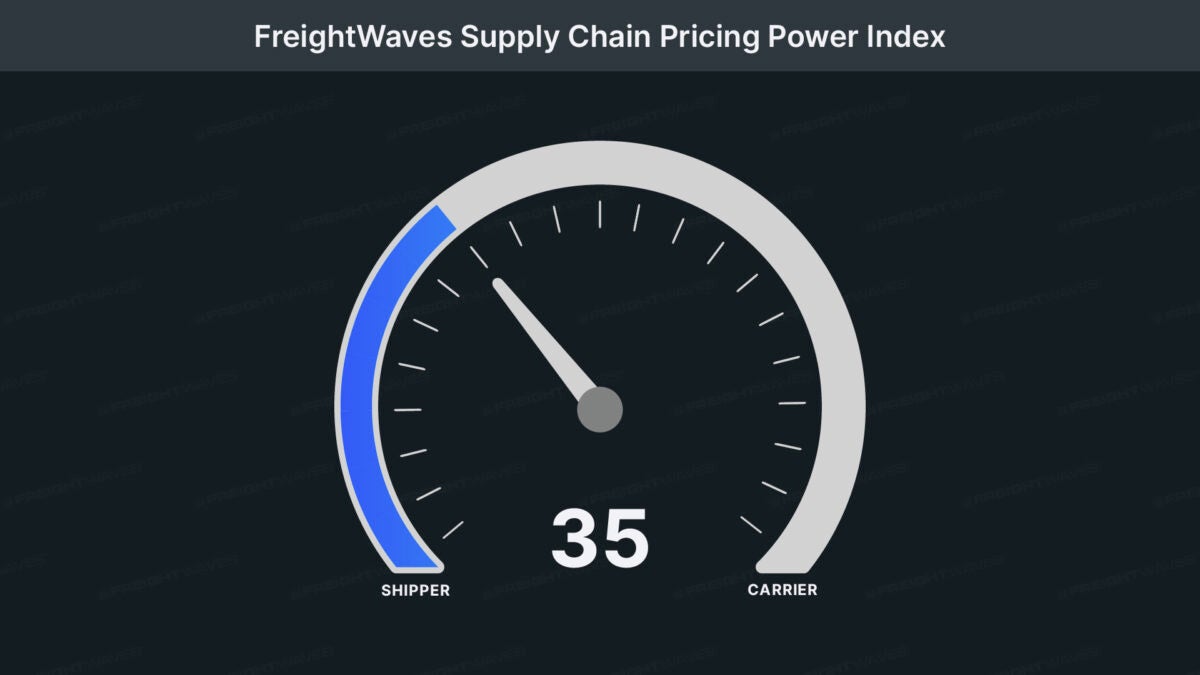
This week’s FreightWaves Supply Chain Pricing Power Index: 35 (Shippers)
Last week’s FreightWaves Supply Chain Pricing Power Index: 35 (Shippers)
Three-month FreightWaves Supply Chain Pricing Power Index Outlook: 40 (Shippers)
The FreightWaves Supply Chain Pricing Power Index uses the analytics and data in FreightWaves SONAR to analyze the market and estimate the negotiating power for rates between shippers and carriers.
This week’s Pricing Power Index is based on the following indicators:
Volume momentum fades, but seasonal trends should take hold in coming weeks
Seasonal patterns of volume lulls during mid-October took hold this week, slightly later than normal as the three disruptions at the beginning of the month helped create a short-term boost for freight demand. In years past, the middle of November was the time frame when demand started to gain momentum into the holiday season, so expect something similar this year, especially with Thanksgiving and Black Friday being the latest date possible.
To learn more about FreightWaves SONAR, click here.
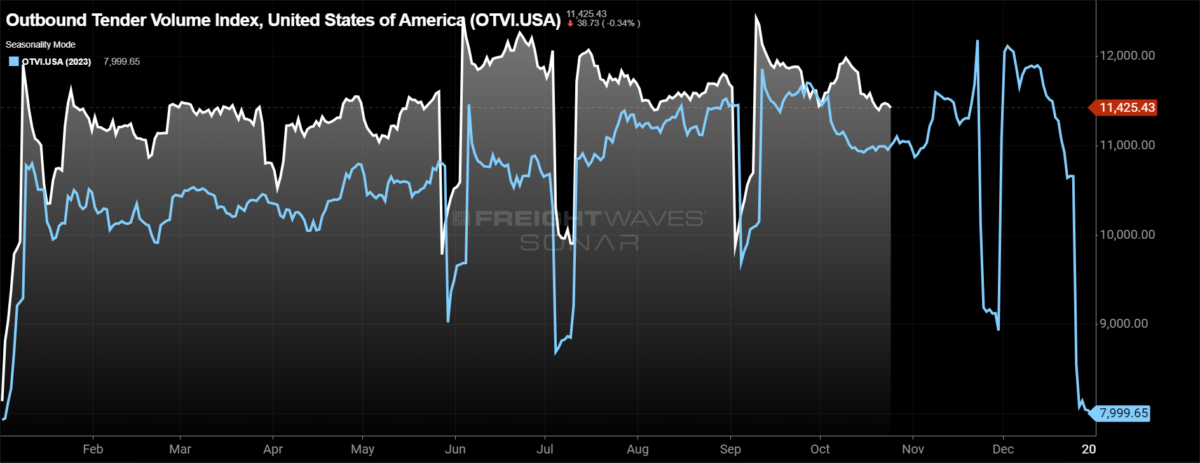
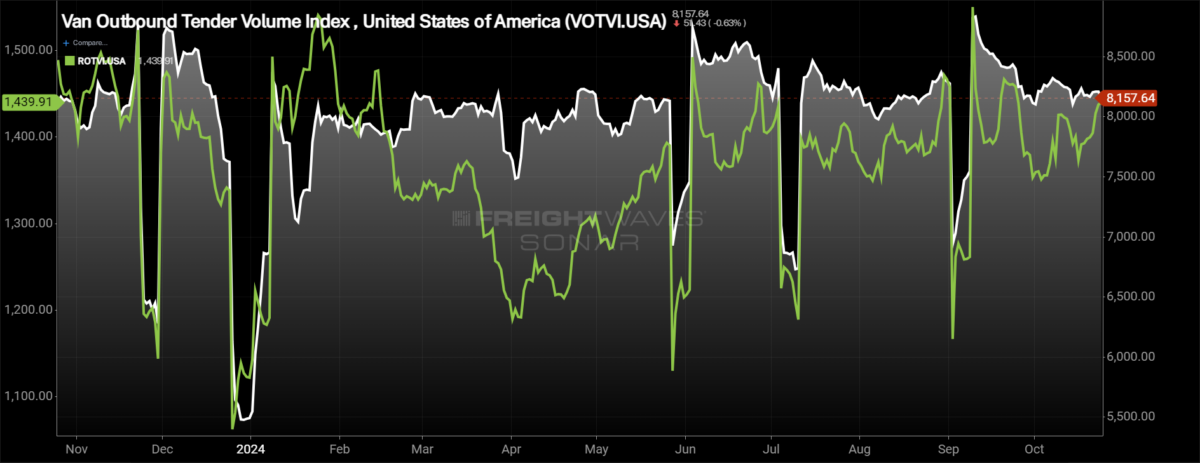
The Outbound Tender Volume Index (OTVI), a measure of national freight demand that tracks shippers’ requests for trucking capacity, continued to trend lower after last week’s sizable drop, falling by 1.38% week over week. Even with back-to-back weeks of decline in freight demand, the OTVI is holding on to the year-over-year gains, currently 2.9% higher.
If there was a bright spot in a week in which volumes declined at the national level, it’s that long-haul, loads moving more than 800 miles, held up the best across the mileage band. Long-haul volumes fell by just 0.07% w/w in comparison to local loads moving under 100 miles, volumes of which were down 3.83%.
To learn more about FreightWaves SONAR, click here.
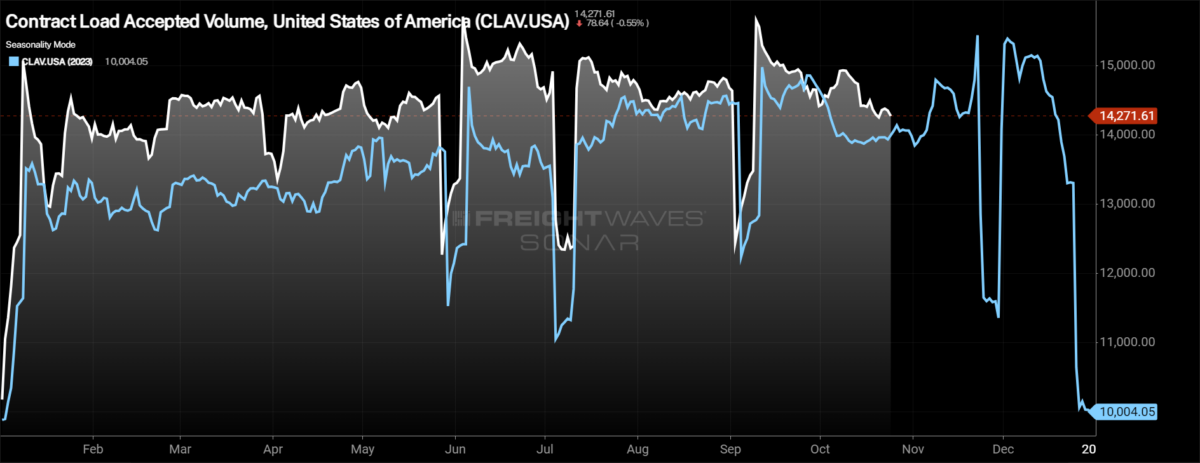
Contract Load Accepted Volume (CLAV) is an index that measures accepted load volumes moving under contracted agreements. In short, it is similar to OTVI but without the rejected tenders. Looking at accepted tender volumes, the decline was larger than the decline in OTVI thanks to an increase in rejection rates, falling by 1.53% over the past week. The growth in CLAV is far less impressive on a y/y basis, up just 0.95% y/y.
Spending has rebounded following a lull due to Hurricane Milton, according to Bank of America’s latest card spending report. Total card spending per household was up 1.9% y/y, but removing autos spending, it was up 0.9% y/y for the most recent week for which data is available, the week of Oct. 19. General merchandise spending is leading the way, up 5.7% y/y, followed closely by clothing, which is up 5.5% y/y after facing significant pressure earlier this month.
To learn more about FreightWaves SONAR, click here.
With the decline in freight demand overall, one would expect the majority of freight markets to experience lower volumes week over week, but that wasn’t the case this week. Of the 135 freight markets tracked within FreightWaves SONAR, 69 had higher volumes compared to last week, up from 51 in the week prior.
The markets that experienced the volume growth are smaller freight markets, thus they don’t have a significant impact on the overall direction of freight demand at the national level. The largest increase in volume this week was Terre Haute, Indiana, where volumes grew by 40.27%, but the market represents just 0.25% of total outbound freight in the country.
The Ontario, California, market, the largest in the country by outbound volume, representing 4.16% of total volume in the country, saw volumes fall by 5.03% over the past week. The second-largest market, Atlanta, which represents 3.39% of outbound volume, saw volumes decline by 1.84% w/w.
To learn more about FreightWaves SONAR, click here.
By mode: The dry van market continues to retreat from the highs recently, accelerating its declines in volume over the past week. The Van Outbound Tender Volume Index fell by 0.9% over the past week after falling by 0.4% last week. With the decline in volumes over the past week, dry van volumes turned negative year over year this week, now down 0.11% y/y.
The reefer market remains quite volatile, breaking its decline in volumes this week. The Reefer Outbound Tender Volume Index increased by 3.47%, one of the strongest weeks in terms of growth this year. Even with the increase this week, reefer demand is still down over the past year, currently 1.46% lower.
Rejection rates holding above 5%
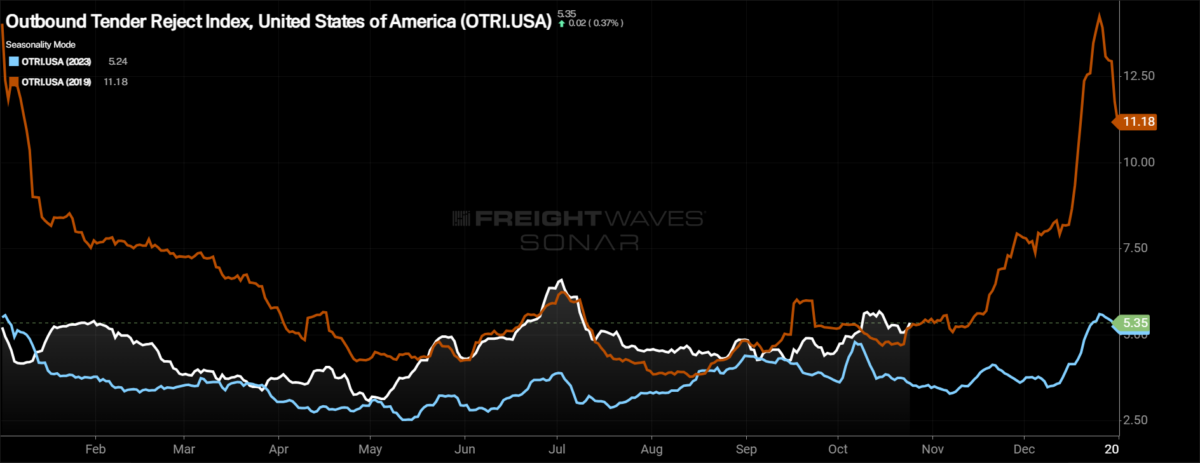
After it looked like rejection rates would quickly fall back under 5% as network fluidity improved following Hurricane Milton, they have actually stabilized above the 5% mark. This level, while still indicative of a loose freight market, is important heading into the holiday season as tender rejection rates last year peaked at just 5.6%.
To learn more about FreightWaves SONAR, click here.
Over the past week, the Outbound Tender Reject Index (OTRI), a measure of relative capacity, increased by 15 basis points to 5.35%, a positive sign for carriers heading into peak season. At present, the OTRI is 183 bps higher than it was this time last year and 14 bps higher than it was in 2019. The trends established in 2019 remain currently. If that continues for the final two months of the year, rejection rates will reach double digits for the first time since April 2022.
To learn more about FreightWaves SONAR, click here.
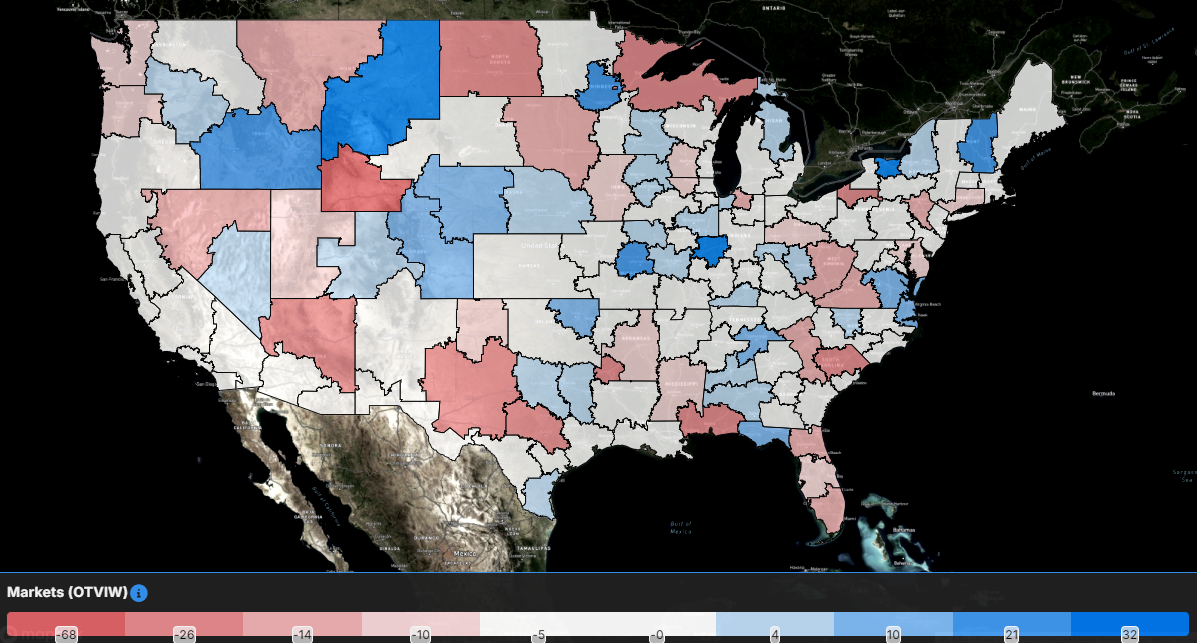
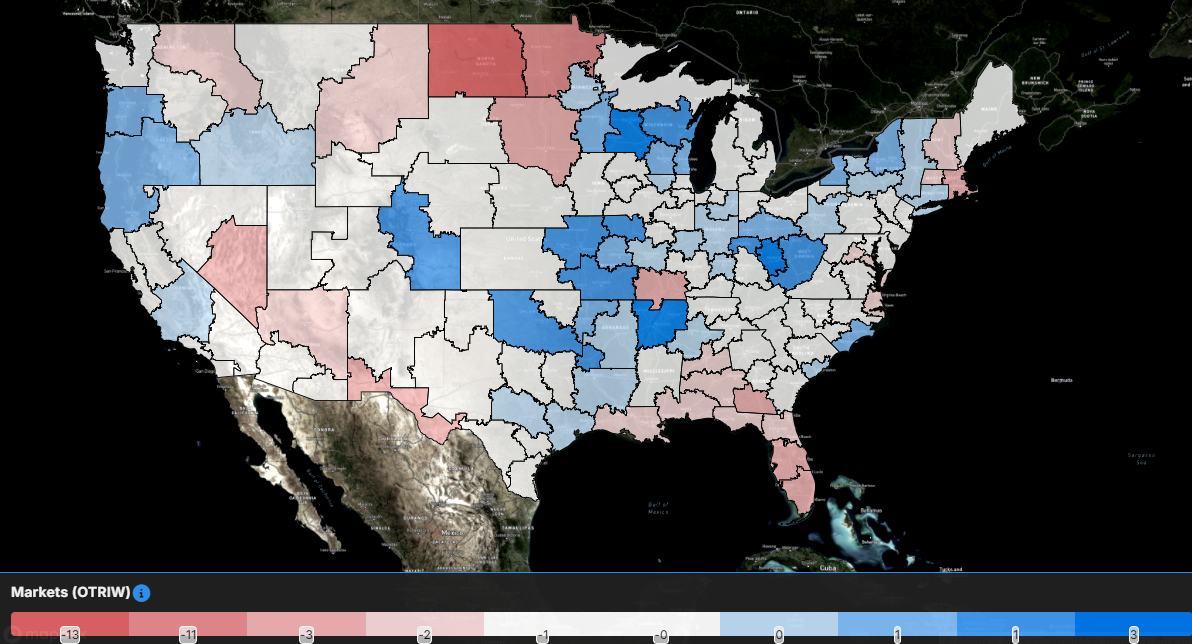
The map above shows the Outbound Tender Reject Index — Weekly Change for the 135 markets across the country. Markets shaded in blue are those where tender rejection rates have increased over the past week, whereas those in red have seen rejection rates decline. The bolder the color, the more significant the change.
Of the 135 markets, 71 reported higher rejection rates over the past week, an increase from 40 that experienced increases in last week’s report.
The middle of the country experienced significant increases in rejection rates over the past week. The Memphis, Tennessee, market saw rejection rates increase by 336 bps over the past week, the third-largest increase across the country. Kansas City, Missouri, also experienced a fairly large increase in rejection rates over the past week, rising 214 bps.
The largest markets in the country also saw higher rejection rates the past week, but the increases weren’t all that significant. In Ontario, tender rejection rates rose just 29 bps, and in Atlanta the increase was even smaller as tender rejection rates increased by just 5 bps w/w.
To learn more about FreightWaves SONAR, click here.
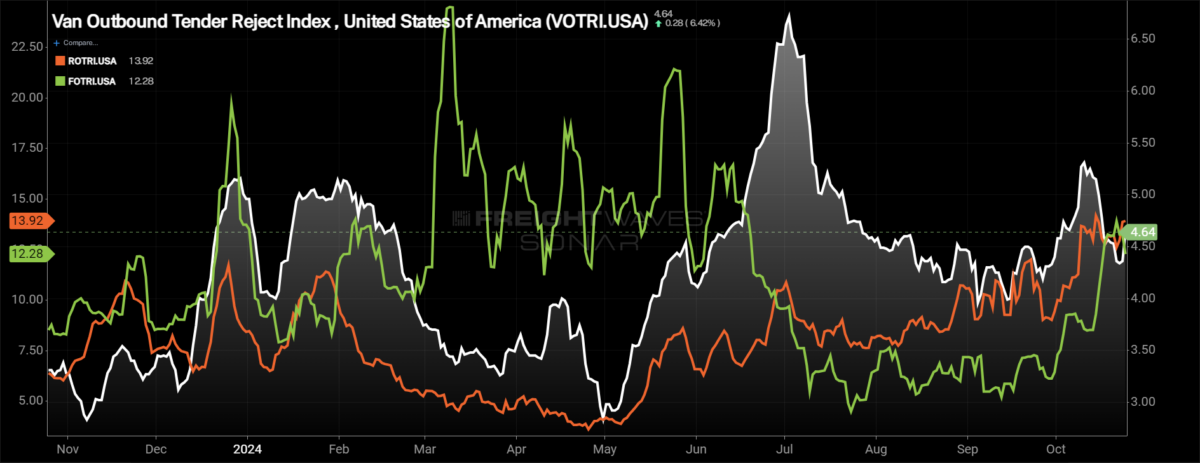
By mode: Dry van capacity remains readily available as dry van rejection rates remain below 5%, but the good news is dry van rejection rates aren’t challenging the recent lows at the moment. The Van Outbound Tender Reject Index rose by 12 bps over the past week to 4.64%. Dry van rejection rates are 133 bps higher than they were this time last year.
Reefer rejection rates have been trending higher in aggregate, but not without intermittent volatility on the way up. The Reefer Outbound Tender Reject Index increased by 82 bps over the past week to 13.92%, just 26 bps off the year-to-date high set earlier this month. Reefer rejection rates are 762 bps higher than they were this time last year.
The flatbed market continues to combat still-elevated interest rates and limited capital expenditures that are impacting the industrial side of the economy. Even so, flatbed tender rejection rates are higher than they were this time last year. Over the past week, the Flatbed Outbound Tender Reject Index fell by 60 bps to 12.28%, but that is still 350 bps higher than it was this time last year.
Spot rates continue to move higher, reacting to the upward move in rejection rates earlier this month
Spot rates took a second to react to changes in the market, but for two consecutive weeks they have moved higher. For carriers that operate in the spot market, this is a positive sign because the higher that spot rates move ahead of the holiday season, the higher the baseline will be when seasonal pressures move spot rates higher.
To learn more about FreightWaves SONAR, click here.
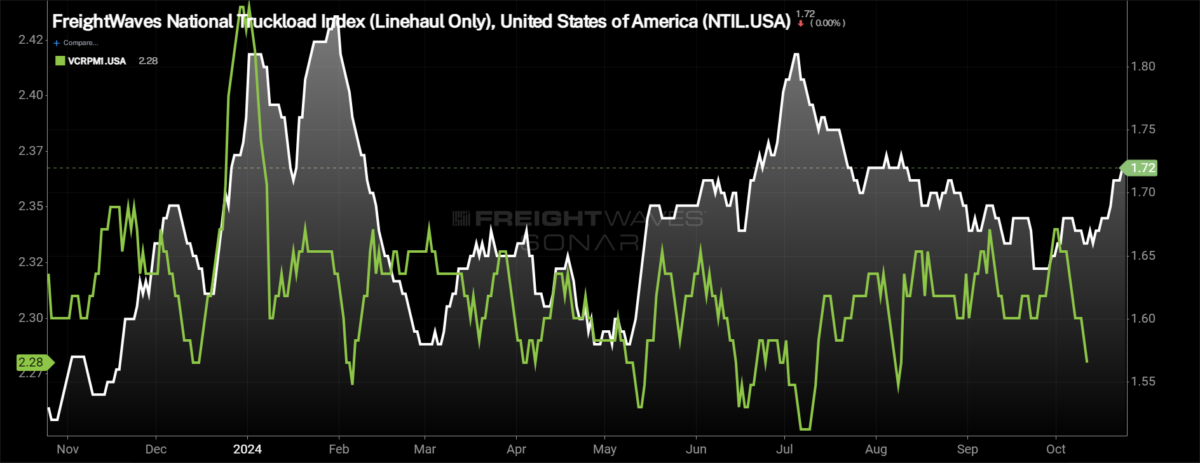
This week, the National Truckload Index — which includes fuel surcharge and various accessorials — continued to rise over the past week, rising 4 cents per mile after last week’s 2-cent-per-mile increase, now up to $2.28. With the increase, the NTI turned positive y/y for the first time in over a month, now 6 cents per mile higher y/y. The linehaul variant of the NTI (NTIL) — which excludes fuel surcharges and other accessorials — increased in line with the overall NTI, a sign that fuel prices didn’t have an impact on spot rate direction this week. The NTIL rose by 4 cents per mile to $1.72. In a positive sign for those participating in the spot market, the NTIL is 19 cents per mile higher y/y, an indication that overall rates are moving higher. Fuel prices have been one of the main drivers of why all-in spot rates remained depressed. The average diesel price per gallon at truck stops is 91 cents, or 20.2%, lower than it was at this time last year.
Initially reported dry van contract rates, which exclude fuel, fell slightly over the past week, giving back all of last week’s increase and then some. Over the past week, the initially reported dry van contract rate fell by 4 cents per mile to $2.29. Initially reported dry van contract rates are 8 cents per mile lower than they were this time last year. An interesting comment out of Knight-Swift’s third-quarter earnings release was that in the company’s truckload segment, revenue per loaded mile was flat year over year and slightly higher than it was in the second quarter. This comment shows that the truckload sector has likely seen the bottom from a pricing perspective and 2025 sets up for a more favorable pricing environment.
To learn more about FreightWaves SONAR, click here.
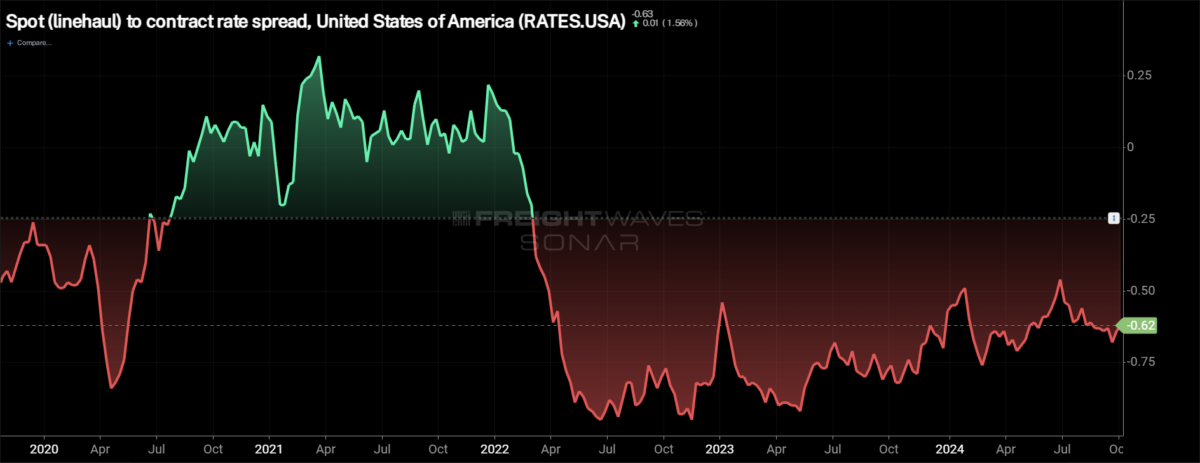
The chart above shows the spread between the NTIL and dry van contract rates is trending back to pre-pandemic levels. The spread remains historically wide but has slowly narrowed the past couple of weeks as spot rates have inched higher and there has been a slight decline in contract rates. Significant disruptions can quickly tighten the spread as spot rates react much faster, so seeing a narrowing of the spread in the fourth quarter, during truckload peak season, wouldn’t be a surprise. The question is how significant the narrowing is and whether it is sustainable, especially if the first quarter of 2025 is the traditionally soft period for freight demand.
To learn more about FreightWaves TRAC, click here.
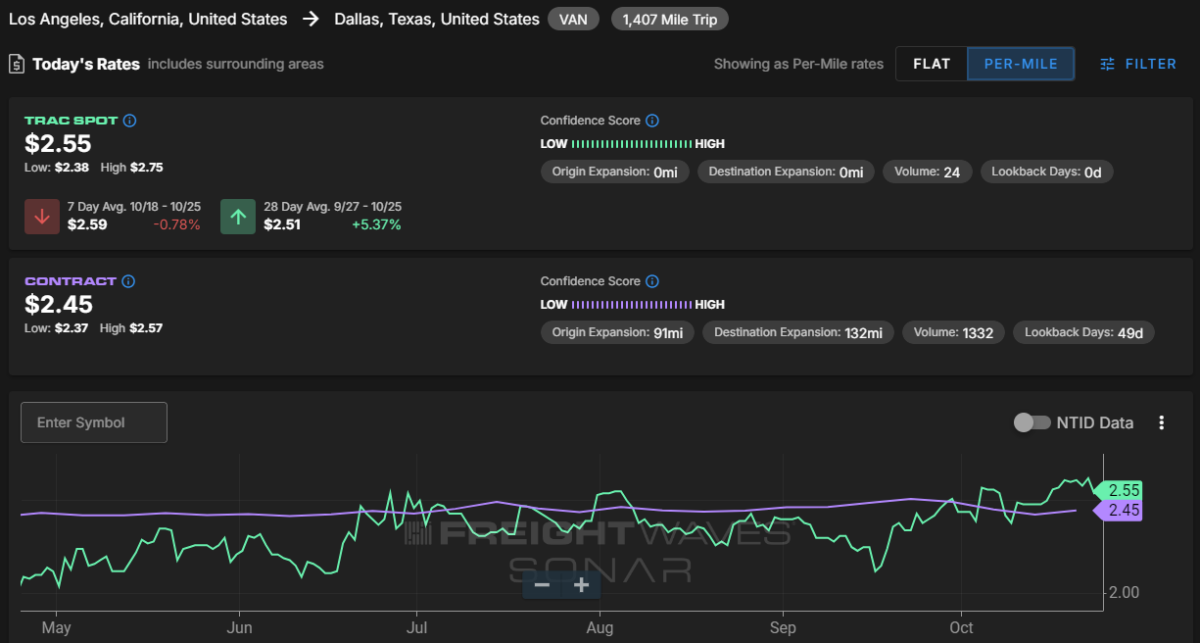
The FreightWaves Trusted Rate Assessment Consortium spot rate from Los Angeles to Dallas gave back some of last week’s gains but is still above the contract rate. The TRAC rate from Los Angeles to Dallas decreased by 2 cents per mile to $2.55. Spot rates along this lane are 10 cents per mile above the contract at present.
To learn more about FreightWaves TRAC, click here.
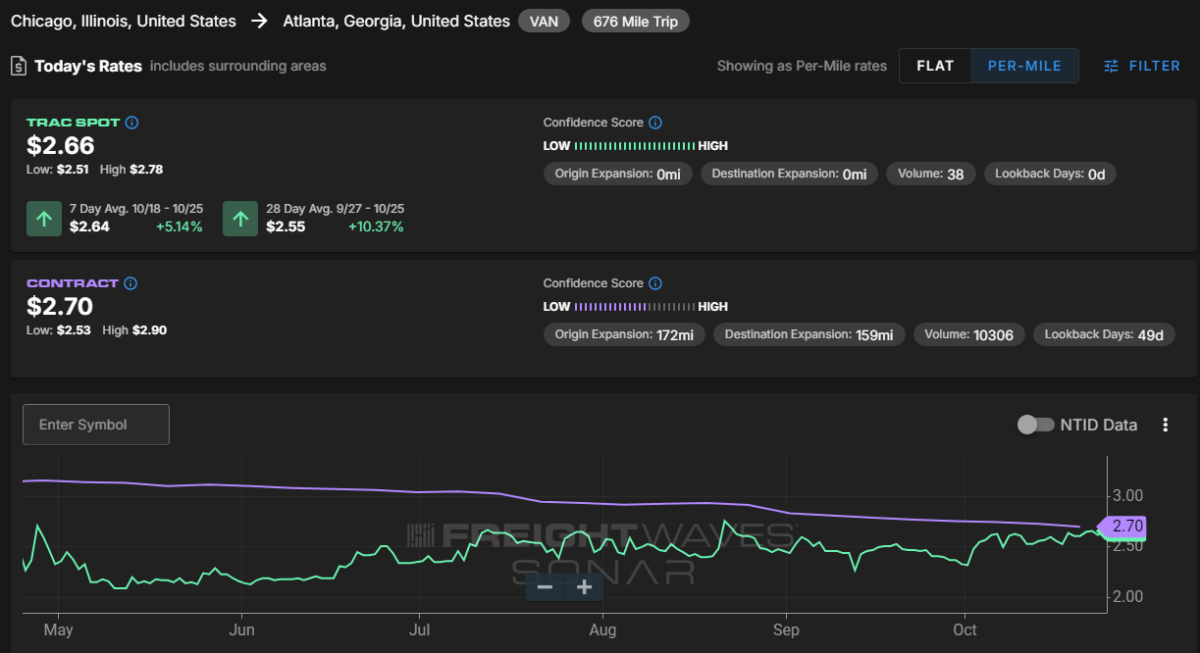
From Chicago to Atlanta, spot rates have been quite volatile since the beginning of the month, though it is hard to see in the chart above due to the scale. The FreightWaves TRAC spot rate along this lane rose by 13 cents per mile to $2.66 over the past week, now just 4 cents per mile below the contract rate.
The post Rejection rates holding above 5% ahead of ‘peak season’ appeared first on FreightWaves.


