
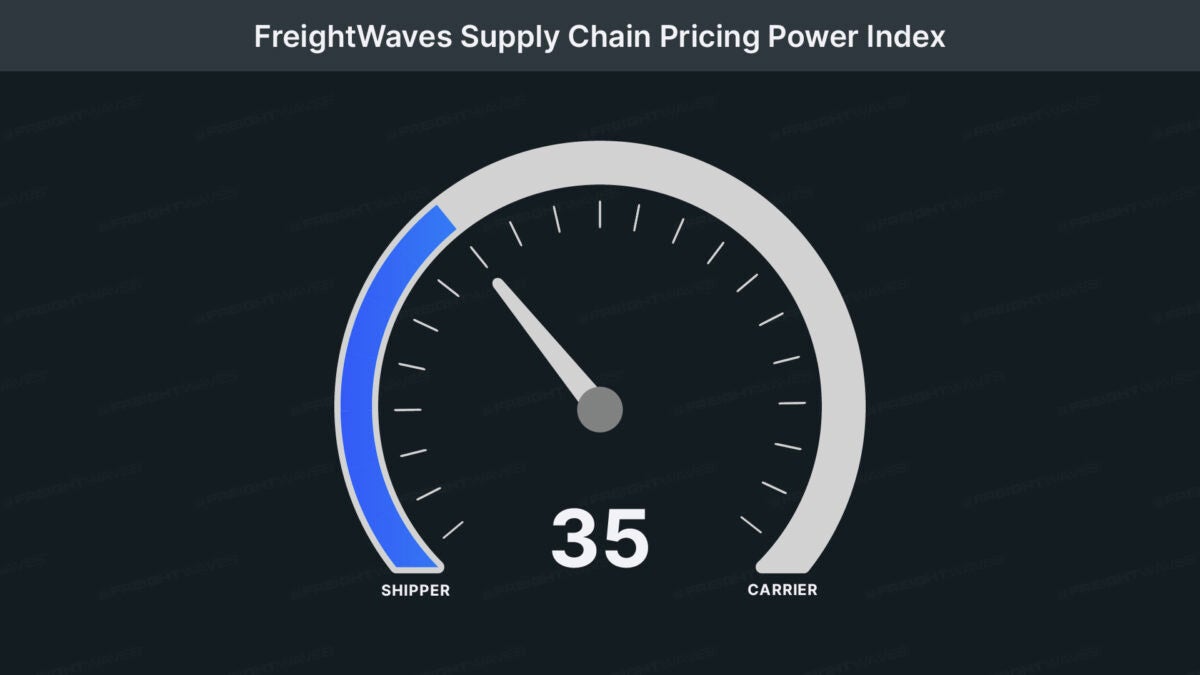
This week’s FreightWaves Supply Chain Pricing Power Index: 35 (Shippers)
Last week’s FreightWaves Supply Chain Pricing Power Index: 35 (Shippers)
Three-month FreightWaves Supply Chain Pricing Power Index Outlook: 40 (Shippers)
The FreightWaves Supply Chain Pricing Power Index uses the analytics and data in FreightWaves SONAR to analyze the market and estimate the negotiating power for rates between shippers and carriers.
This week’s Pricing Power Index is based on the following indicators:
Tender volumes recover, especially in short lengths of haul
Less than a week after the International Longshoremen’s Association strike came and went, another supply chain disruption hit the market. Hurricane Milton made landfall just south of Tampa on Wednesday evening, not only significantly impacting the Lakeland, Florida, freight market, but also affecting the overall market in the Southeast.
To learn more about FreightWaves SONAR, click here.
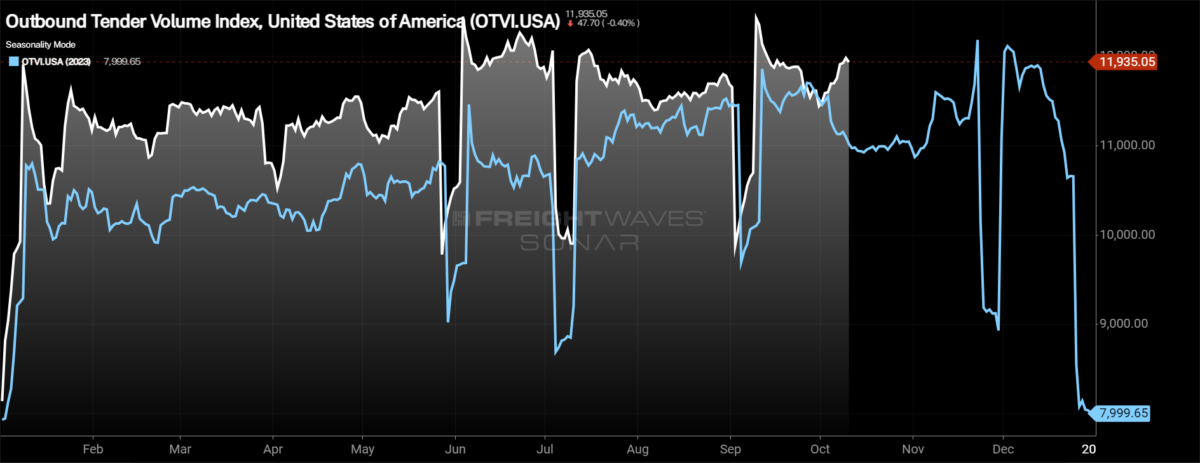
The Outbound Tender Volume Index (OTVI), a measure of national freight demand that tracks shippers’ requests for trucking capacity, had one of its strongest weeks as volumes have increased by 2.91%. After a brief negative year-over-year stint, the OTVI is now 8.3% higher than it was at this time last year.
The growth continues to be driven by the shorter lengths of haul, mainly loads moving under 250 miles. Long-haul volumes – loads moving more than 800 miles – have continued to decline so far in October.
To learn more about FreightWaves SONAR, click here.
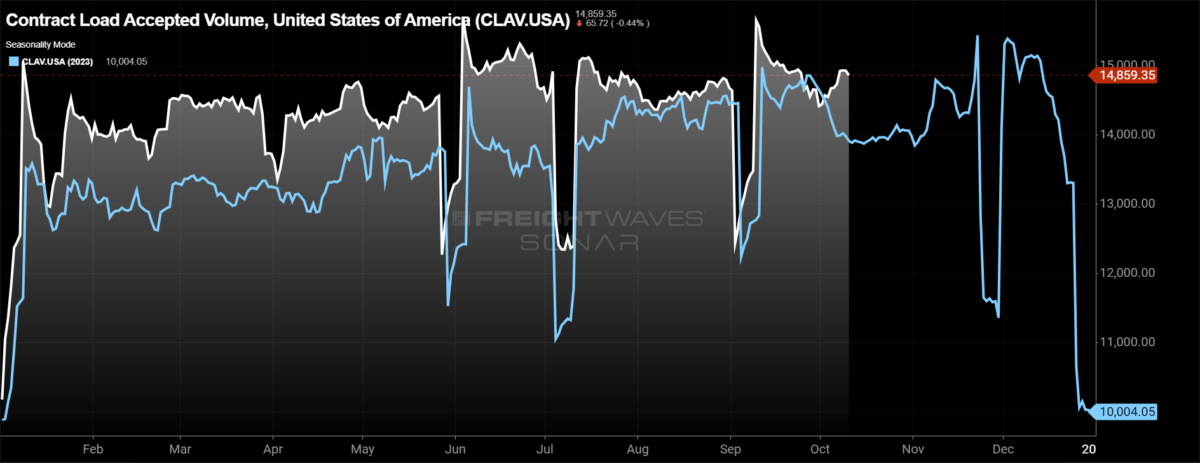
Contract Load Accepted Volume (CLAV) is an index that measures accepted load volumes moving under contracted agreements. In short, it is similar to OTVI but without the rejected tenders. Looking at accepted tender volumes, the growth isn’t as pronounced, as tender rejection rates have moved higher through the week. At present, CLAV is 2.15% higher week over week and 6.79% higher than it was at this time last year.
Bank of America’s card spending in September was softer, falling by 0.9% year over year, but the bank believes the decline has more to do with spending being pulled into August around Labor Day and with fewer weekend days (Fridays and Saturdays), than with an actual slowdown. Seasonally adjusting the data, total card spending was higher 0.6% month over month, setting expectations for strong retail sales figures that are to be released later this week.
To learn more about FreightWaves SONAR, click here.
With a rebound in freight demand overall, the majority of the freight markets across the country experienced higher volumes on a week-over-week basis. Of the 135 freight markets tracked within FreightWaves SONAR, 81 had higher volumes compared to last week, down from 59 in the week prior.
Volume levels were lower in most of the largest freight markets, including Ontario, California, where they fell by 0.76% w/w, and Atlanta, where volumes were down 3.05% w/w. The Harrisburg, Pennsylvania, and Dallas markets were two where volumes grew over the past week, rising 9.58% and 10.78%, respectively.
The largest increases over the past week have been from relatively small freight markets, including Bowling Green, Kentucky, which saw a more than 40% rise.
To learn more about FreightWaves SONAR, click here.
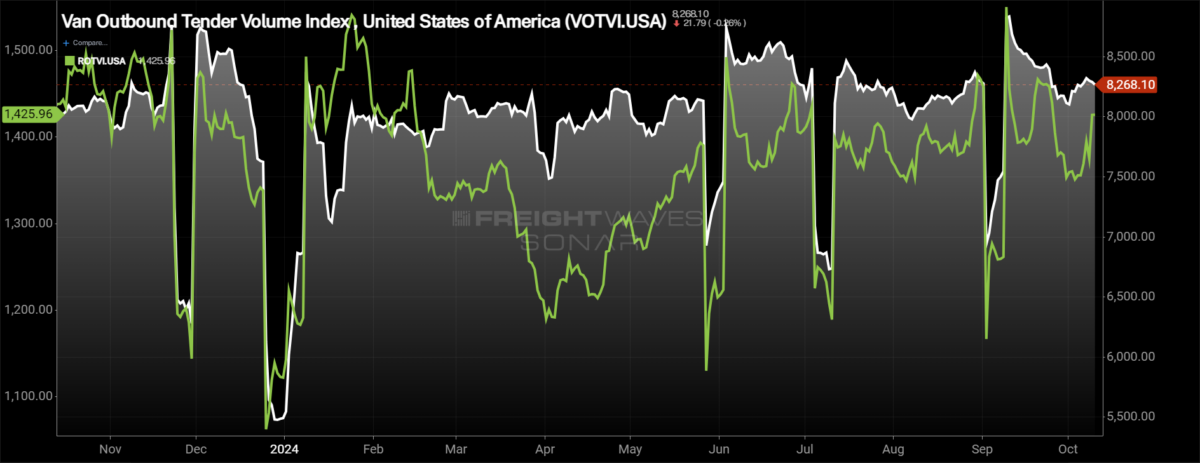
By mode: Growth in the dry van market was far less impressive than the overall market this week. The Van Outbound Tender Volume Index increased by 0.71% week over week. Compared to this time last year, dry van tender volumes are 2.46% higher, but they are still below levels between Memorial Day and the Fourth of July holiday.
The reefer market was far more impressive this week in terms of volume growth. The Reefer Outbound Tender Volume Index (ROTVI) increased by 5.54% over the past week, showing some signs of recovery after a significant slowdown to close out September. Reefer volumes turned positive y/y with the growth this week, as ROTVI is now up 0.67% y/y.
Rejection rates now approaching Fourth of July holiday levels
Rejection rates continued to surge higher this week, again eclipsing the 5% that has been the level to watch in the months following the Fourth of July holiday. The increase is a positive sign for the freight market heading into traditional peak season.
To learn more about FreightWaves SONAR, click here.
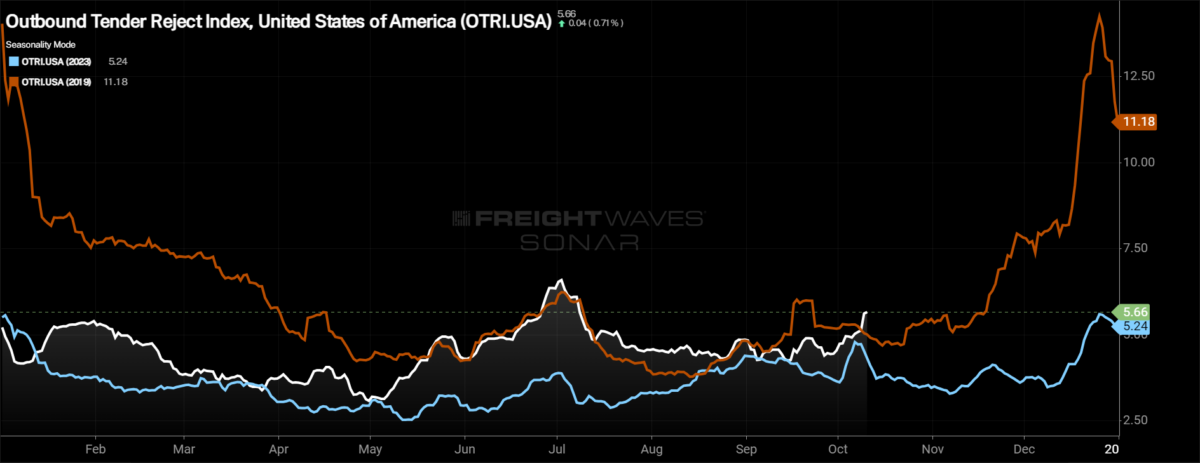
Over the past week, the Outbound Tender Reject Index (OTRI), a measure of relative capacity, increased by 70 basis points to 5.66%, moving to one of the highest levels of the past year. The OTRI is now 134 basis points above last year’s levels. This week’s increase is a signal that the market is even more reactive to outside influences. Rejection rates are back above 2019 levels, now 65 basis points above where they were at this time in 2019, compared with the 34 bps below 2019 that they were at this time last week.
To learn more about FreightWaves SONAR, click here.
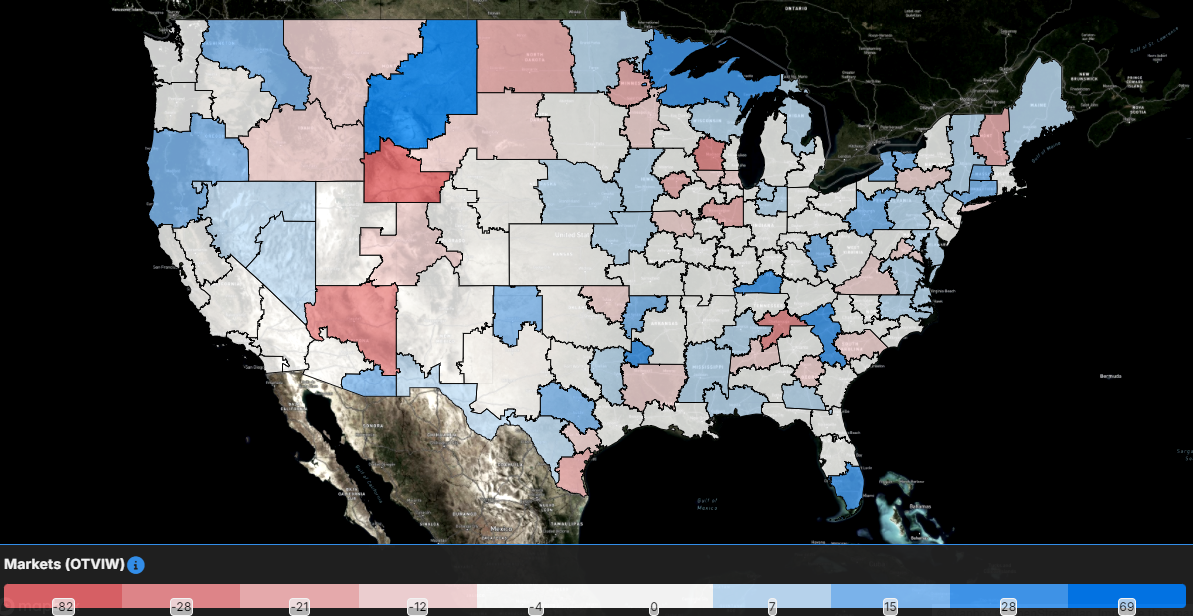
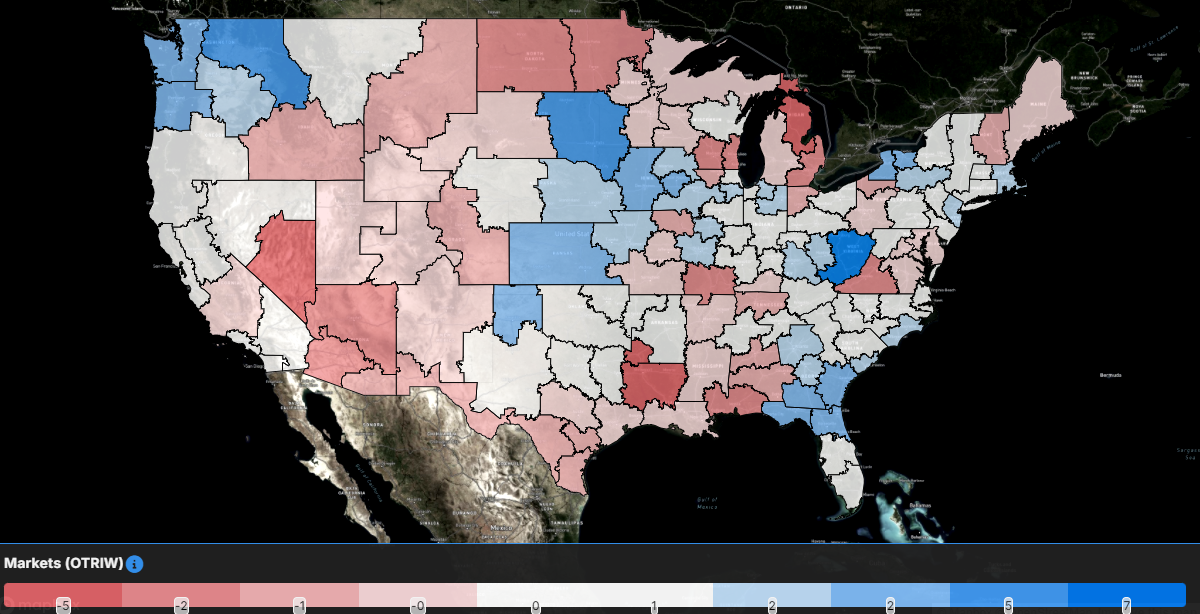
The map above shows the Outbound Tender Reject Index — Weekly Change for the 135 markets across the country. Markets shaded in blue are those where tender rejection rates have increased over the past week, whereas those in red have seen rejection rates decline. The bolder the color, the more significant the change.
Of the 135 markets, just 92 reported higher rejection rates over the past week, an increase from 78 in last week’s report.
Markets where staging for hurricane relief is taking place are where rejection rates arguably increased most significantly over the past week. The Jacksonville, Florida, market saw rejection rates jump by 400 bps, and neighboring market Savannah, Georgia, saw rejection rates jump by 337 bps.
The biggest freight markets in the country largely saw rejection rates move higher over the past week. In Atlanta, rejection rates increased by 218 bps w/w. In Elizabeth, New Jersey, rejection rates rose by 219 bps. In Chicago, tender rejection rates increased by 192 bps. In Dallas, the increase was 106 bps. The smallest increase among the largest freight markets was in Ontario, California, where rejection rates rose by 75 bps w/w.
To learn more about FreightWaves SONAR, click here.
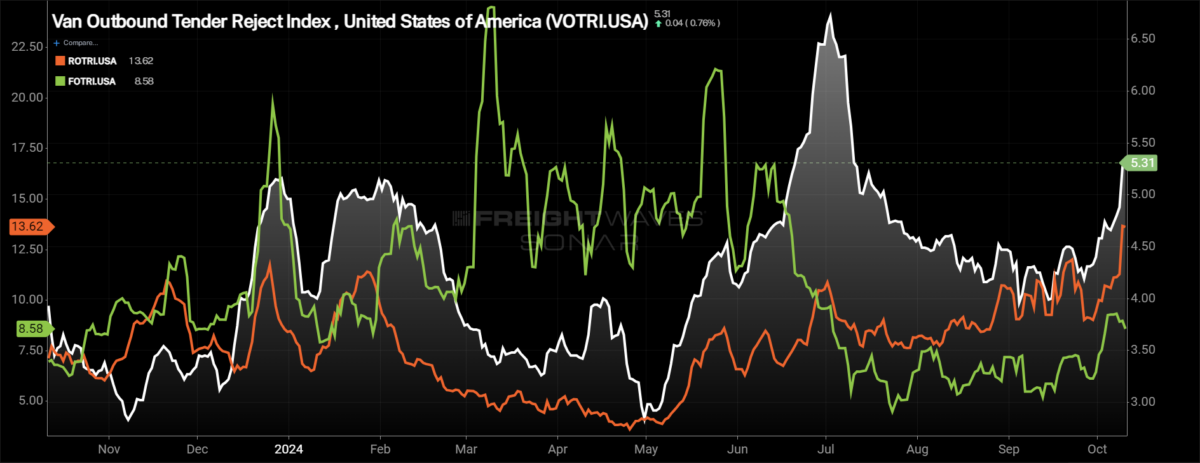
By mode: All of the equipment types in the truckload market saw rejection rates move higher this week. The dry van market experienced a holiday-like increase, reaching the highest levels since the Fourth of July. The Van Outbound Tender Reject Index rose 57 basis points over the past week to 5.31%, up 116 bps from this time last year.
The reefer market continues to see rejection rates rise, now reaching the highest level of the year. The Reefer Outbound Tender Reject Index increased by 290 basis points over the past week to 13.62%. Reefer rejection rates are 619 bps higher year over year.
The flatbed market is going to see activity ramp up as the rebuilding phases of hurricane relief get underway in the Southeast. The Flatbed Outbound Tender Reject Index increased by 24 bps over the past week to 8.58%. Flatbed rejection rates are 154 bps higher than they were this time last year.
Spot rates don’t react to higher rejection rates
Despite the changing rejection rates, spot rates haven’t reacted positively to the movement higher. Spot rates have actually moved lower over the past week, but there are pockets of the country where spot rates have moved higher.
To learn more about FreightWaves SONAR, click here.
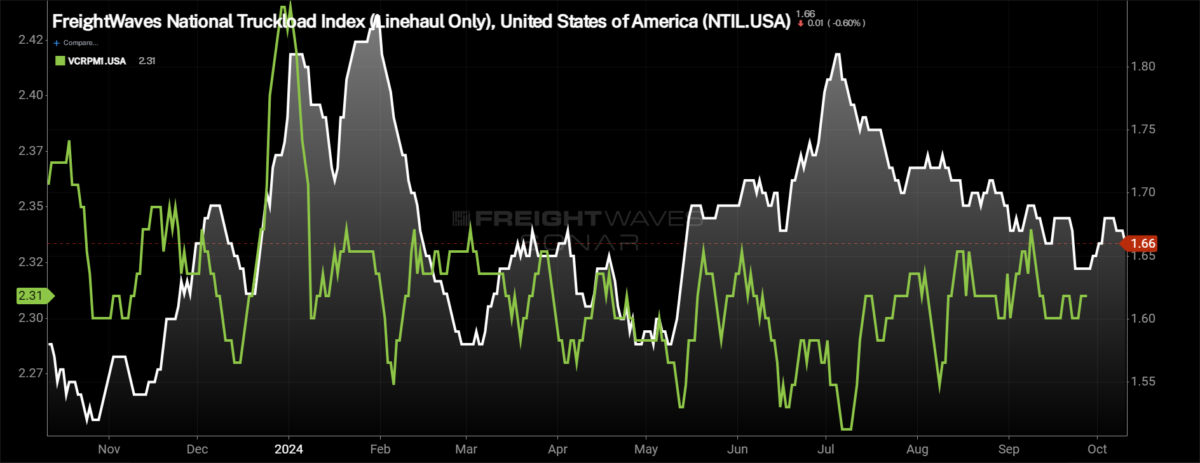
This week, the National Truckload Index — which includes fuel surcharge and various accessorials — reversed course, falling by 1 cent per mile to $2.22. The NTI is still 6 cents per mile or 2.6% lower than it was at this time last year. The increase in the linehaul variant of the NTI (NTIL) — which excludes fuel surcharges and other accessorials — was even larger than the overall spot rate decline, falling by 2 cents per mile to $1.66. The NTIL is 8 cents per mile higher than it was at this time last year. The discrepancy in the NTIL and NTI is solely the changes in diesel. The average diesel truck stop price moved higher this week, rising by 4 cents per gallon. The average diesel truck stop price per gallon is 87 cents, or 19.2%, lower than it was last year.
Initially reported dry van contract rates have stayed in a fairly tight range, remaining stable over the past week at $2.31 per mile. Throughout 2024, contract rates have been in a tight range, an indication that the extreme cost savings are in the rearview mirror and service is now coming to the forefront. Initially reported contract rates are down 4 cents per mile from this time last year, a 1.7% decline.
To learn more about FreightWaves SONAR, click here.
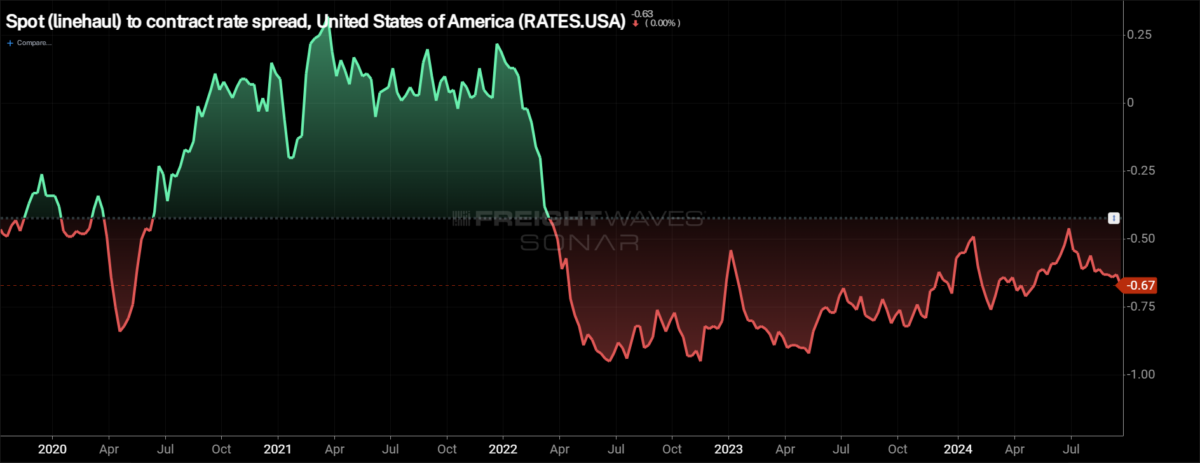
The chart above shows the spread between the NTIL and dry van contract rates is trending back to pre-pandemic levels. The spread remains historically wide and has actually widened in recent weeks, diverting from the pre-pandemic average that it had been inching closer to throughout the year. Significant disruptions can quickly tighten the spread as spot rates react much faster, so seeing a narrowing of the spread in the fourth quarter, during truckload peak season, wouldn’t be a surprise. The question is how significant the narrowing is and whether it is sustainable, especially if the first quarter of 2025 is the traditionally soft period for freight demand.
To learn more about FreightWaves TRAC, click here.
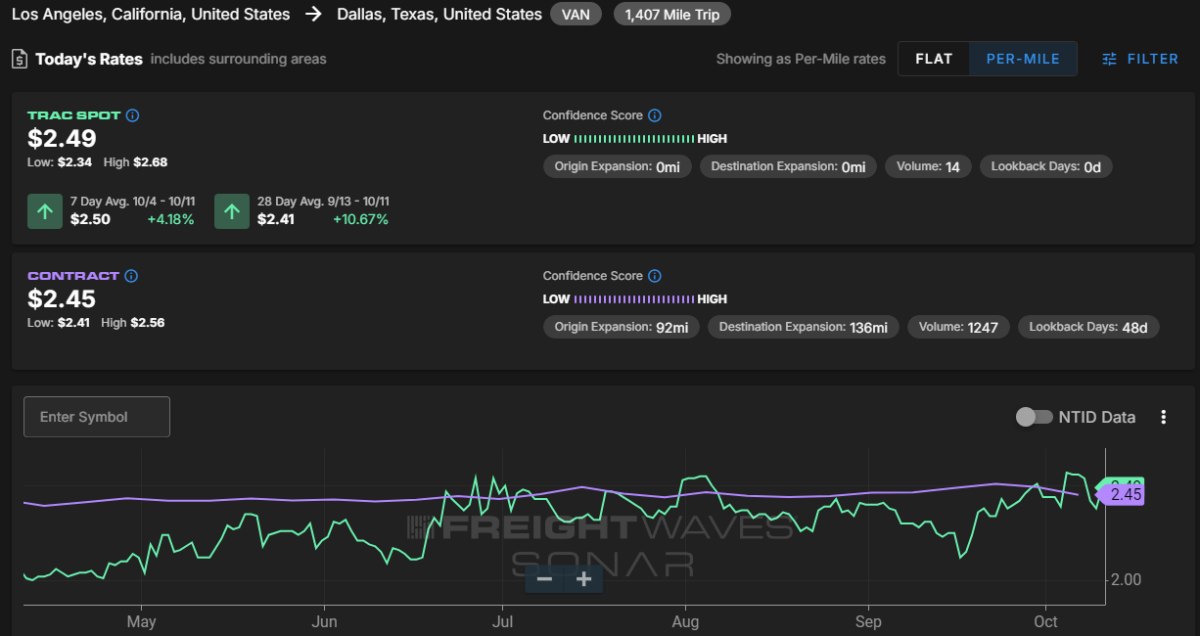
The FreightWaves Trusted Rate Assessment Consortium spot rate from Los Angeles to Dallas fell slightly over the past week but in a significant way. The TRAC rate from Los Angeles to Dallas increased by 10 cents per mile to $2.49. Spot rates crossed over contract rates this week, now 4 cents per mile higher than contract rates.
To learn more about FreightWaves TRAC, click here.
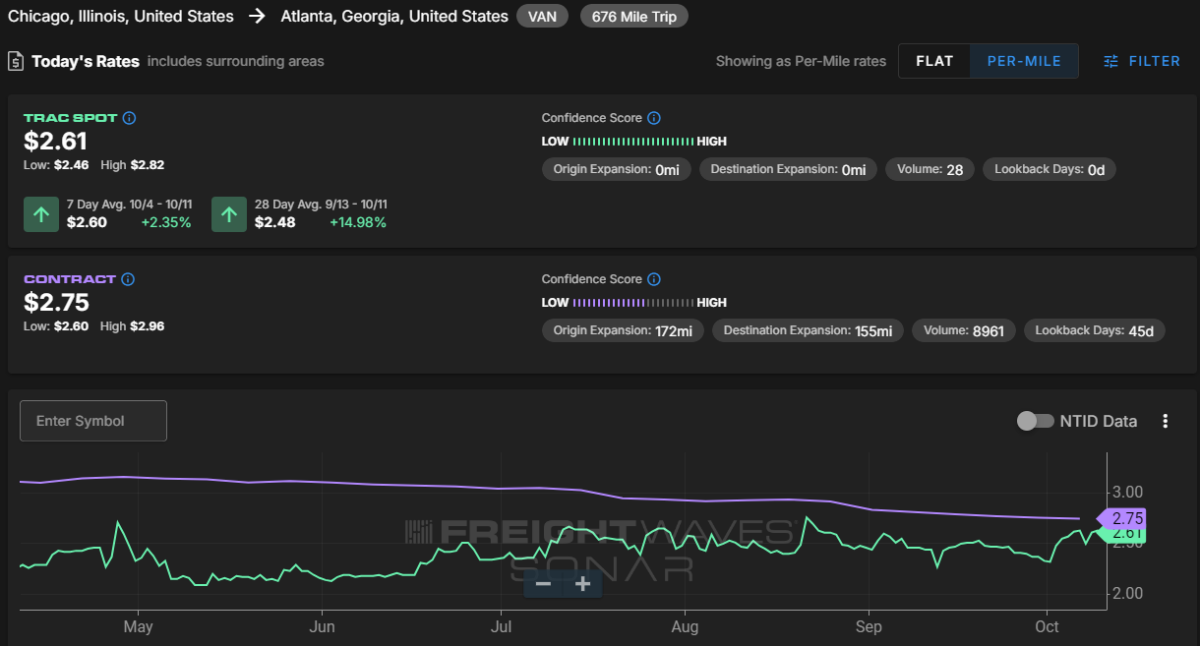
From Chicago to Atlanta, spot rates rebounded to start October. The FreightWaves TRAC spot rate along this lane rose 6 cents per mile to $2.61, now just 14 cents per mile below the contract rate.
The post Hurricane Milton helps boost rejection rates appeared first on FreightWaves.


