
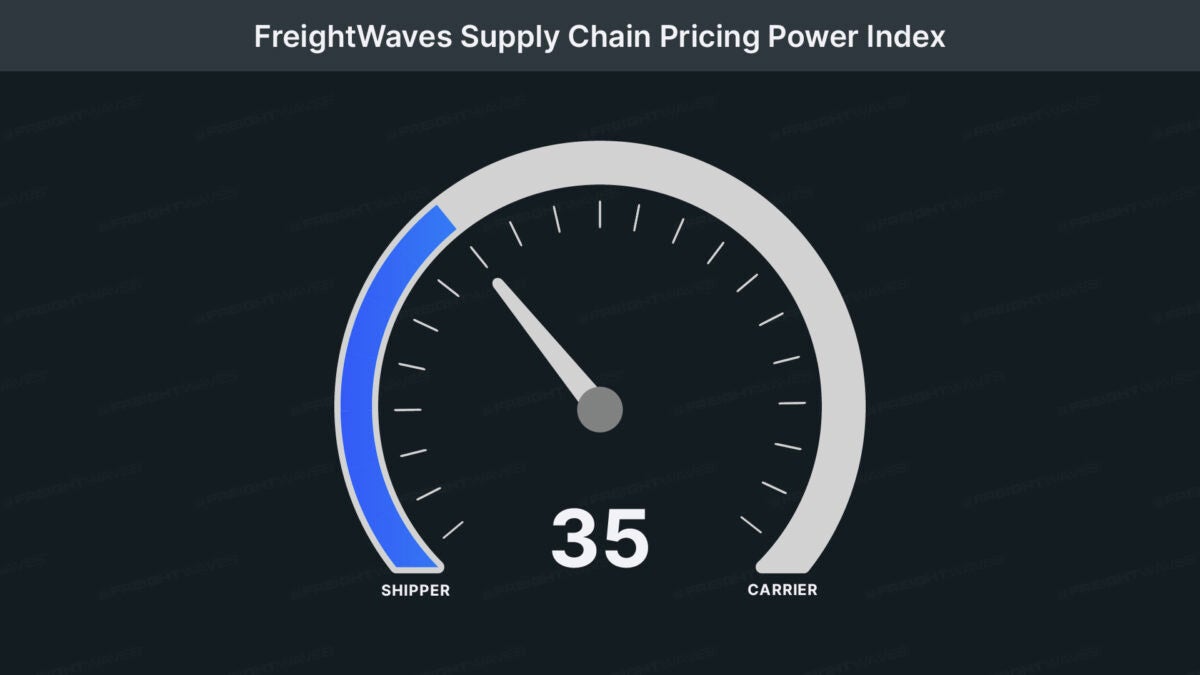
This week’s FreightWaves Supply Chain Pricing Power Index: 35 (Shippers)
Last week’s FreightWaves Supply Chain Pricing Power Index: 35 (Shippers)
Three-month FreightWaves Supply Chain Pricing Power Index Outlook: 40 (Shippers)
The FreightWaves Supply Chain Pricing Power Index uses the analytics and data in FreightWaves SONAR to analyze the market and estimate the negotiating power for rates between shippers and carriers.
This week’s Pricing Power Index is based on the following indicators:
Volumes move higher, but driven by West Coast volumes
The freight market came out of Labor Day with a flourish of volumes. Tender volumes reached the highest level of the year but have since started to retreat. Even so, tender volumes are following a similar trend to what they did this time last year: Volumes finished August higher than where they started, peaked after Labor Day and retreated from the highs. As the fourth quarter approaches, with record import levels flowing into both coasts for the time being, it’ll be interesting to see if volumes grow during October, compared to last year where volumes fell throughout the month.

To learn more about FreightWaves SONAR, click here.
The Outbound Tender Volume Index (OTVI), a measure of national freight demand that tracks shippers’ requests for trucking capacity, is up 2.14% on a two-week stack. Why use the two-week stack compared to week-over-week measures this week? It removes the decline associated with the holiday, creating a more apples-to-apples comparison. The OTVI is now up 4.82% compared to this time last year, showing the continued growth in volumes year over year.

To learn more about FreightWaves SONAR, click here.
Contract Load Accepted Volume (CLAV) is an index that measures accepted load volumes moving under contracted agreements. In short, it is similar to OTVI but without the rejected tenders. Looking at accepted tender volumes, we see an increase of 2.58% on a two-week stack. Why the larger increase compared to OTVI? Rejection rates have been declining since the holiday, so as tender volumes increase and rejection rates decline, CLAV grows faster than OTVI.
Bank of America’s most recent card spending report, for the week ending Sept. 7, showed tepid growth, but excluding autos, spending was down. Total card spending, according to BofA, was up 0.3% year over year, but excluding autos, spending was down 2.2% y/y. Gas spending continues to be a drag on overall spending, down 11.8% y/y, but the declines are likely a factor of lower price as opposed to lower demand.
August’s retail sales data will be released Tuesday, and consensus expectations are for total retail sales to grow by 0.2% m/m. BofA has a slightly different view, expecting a slowdown in retail sales in August’s release, largely due to the fact that sales from April to July were quite strong, so a slowdown wouldn’t be unexpected or concerning.

To learn more about FreightWaves SONAR, click here.
The market has been fairly balanced in terms of the number of markets experiencing volume growth and degradation over the past two weeks. Of the 135 freight markets tracked within FreightWaves SONAR, 77 experienced higher volumes compared to two weeks ago.
The largest freight market in the country, Ontario, California, experienced an increase of 17.64% over the past two weeks. A positive sign for the market is that the increase appears to be an uptick in long-haul (800-plus-mile) volumes, as opposed to continuing being impacted by local (less-than-100-mile) and short-haul (100-to-250-mile) volumes. The challenge in the market is that capacity has reacted, flooding into the market. Thus the surge in volumes didn’t catch anyone off guard, as it appeared to do earlier in the summer.

To learn more about FreightWaves SONAR, click here.
By mode: The dry van market has been able to carry some momentum established in August into September. The Van Outbound Tender Volume Index has increased by 2.93% over the past two weeks, reaching the highest level since early December of last year. Dry van volumes are up 5.37% y/y.
The reefer market has experienced a dramatic drop in volumes to start September after peaking following the holiday. Over the past two weeks, the Reefer Outbound Tender Volume Index is down 1.4% and is 4.2% lower y/y.
Rejection rates dropping near 4% as capacity reduction slows
Neither Hurricane Francine nor Labor Day was enough to create a boost in rejection rates, highlighting that the freight market still has an abundance of capacity. Carrier exits continue, but the rate of declines slowed throughout the summer months. The Logistics Managers’ Index highlighted in August’s report that transportation capacity expanded during the month and attributed it to the possibility of smaller carriers and owner-operators “getting off the sidelines.”

To learn more about FreightWaves SONAR, click here.
Over the past week, the Outbound Tender Reject Index (OTRI), a measure of relative capacity, actually increased by 17 basis points to 4.45%, though that was against an easy comp as what capacity was offline for Labor Day returned to the market. At present, the OTRI is 19 basis points higher y/y but 40 bps below 2019 levels.

To learn more about FreightWaves SONAR, click here.
The map above shows the Outbound Tender Reject Index — Weekly Change for the 135 markets across the country. Markets shaded in blue are those where tender rejection rates have increased over the past week, whereas those in red have seen rejection rates decline. The bolder the color, the more significant the change.
Of the 135 markets, 74 reported higher rejection rates over the past week, an increase from 49 in last week’s report.
The largest increases in rejection rates over the past week stemmed from smaller freight markets like Huntington, West Virginia, where rejection rates increased by 686 basis points w/w.
With the significant increase in volume out of Ontario, California, one might expect rejection rates to move higher as there would be optionality in the market, but that wasn’t the case. Rejection rates in Ontario are 35 bps lower than they were this time last week and are 154 basis points lower over the past two-weeks.

To learn more about FreightWaves SONAR, click here.
By mode: The dry van market continues to struggle to find any positive momentum as dry van tender rejection rates are now back to levels not seen since mid-May. The Van Outbound Tender Reject Index has fallen by 32 basis points over the past two weeks to 4.15%. Van rejection rates are slightly higher than they were this time last year, up 34 bps y/y.
The reefer market continues to see tender rejection rates creep higher, now back above 10%. Over the past week, the Reefer Outbound Tender Reject Index increased by 130 bps to 10.55%. Reefer rejection rates have turned positive year over year once again, now 119 bps higher.
Interest rate cuts can’t come soon enough for the flatbed sector. Luckily enough, the Federal Open Market Committee meeting on Tuesday and Wednesday is likely to bring that news, though it appears a 25-basis-point cut is on the table based on the recent macroeconomic data releases. The Flatbed Outbound Tender Reject Index fell by 205 basis points over the past week to 5.2%. Flatbed tender rejection rates are 316 bps lower y/y.
Spot rates continue to fade as market was less reactive to outside influences
With tender rejection rates continuing to slide, spot rates have followed suit. The holiday as well as Hurricane Francine had little to no impact on the market, and as a result, spot rates have fallen to the lowest level in over three months. Until there is a substantial reduction in capacity, there will be limited opportunities for spot rates to move significantly higher for a longer period of time outside of holidays.

To learn more about FreightWaves SONAR, click here.
This week, the National Truckload Index — which includes fuel surcharge and various accessorials — fell by 1 cent per mile from the week prior at $2.24 per mile. The NTI is now 8 cents per mile or 3.4% lower than it was this time last year, the largest decline y/y of 2024. The linehaul variant of the NTI (NTIL) — which excludes fuel surcharges and other accessorials — was unchanged this week at $1.67. The NTIL is still 5 cents per mile higher than it was at this time last year. The discrepancy in the NTIL and NTI is solely the changes in fuel, which was far more expensive in 2023 than currently. The average diesel truck spot price per gallon is 87 cents, or 19.2%, lower than it was last year.
Initially reported dry van contract rates remain in a fairly tight range, falling by 1 cent per mile over the past week to $2.30. Throughout 2024, contract rates have been in a tight range, an indication that the extreme cost savings are in the rearview mirror and service is now coming to the forefront. Initially reported contract rates are down 7 cents per mile from this time last year, a 3% decline.

To learn more about FreightWaves SONAR, click here.
The chart above shows the spread between the NTIL and dry van contract rates is trending back to pre-pandemic levels. The spread remains historically wide but has continued to move back to more normal levels. The shift in this chart can happen quickly if there is a substantial uptick in spot rates. This creates a challenge if a spot rate increase is sustained and not just a short-term event.

To learn more about FreightWaves TRAC, click here.
The FreightWaves Trusted Rate Assessment Consortium spot rate from Los Angeles to Dallas was back on the decline, despite the increase in outbound volume. The TRAC rate from Los Angeles to Dallas fell by 3 cents per mile, nearly erasing all of last week’s increase, to $2.28 per mile. Spot rates along this lane are 22 cents per mile below the contract rate.

To learn more about FreightWaves TRAC, click here.
From Chicago to Atlanta, the TRAC rate reversed course this week with a substantial decline. It fell by 19 cents per mile to $2.26, the highest level since mid-June. The spot rate on this lane is now 55 cents per mile below the contract rate.
The post Hurricane Francine does nothing to help freight market appeared first on FreightWaves.


