
The FMCSA’s Compliance, Safety, Accountability (CSA) program has been the trucking industry’s de facto safety scorecard for 15 years, yet it remains one of the most polarizing tools in freight. Ask a carrier safety director what a CSA score really means and you’ll get an eye-roll followed by an indignant rant. Ask a shipper’s risk manager the same question, and many will still treat those seven BASIC percentiles as objective truth when deciding which motor carriers make the approved list.
Both sides of the market look at the same data from valid perspectives, but both are missing the big picture: in its current form, CSA tells only part of the safety story—and it distorts the part it does tell.
At its core, the CSA Safety Measurement System (SMS) ranks carriers monthly in seven Behavior Analysis and Safety Improvement Categories (BASIC): Unsafe Driving, Hours-of-Service Compliance, Driver Fitness, Vehicle Maintenance, Controlled Substances/Alcohol, Hazardous Materials Compliance, and the once-public Crash Indicator. More on that in a minute.
Data flows almost entirely from roadside inspections conducted by state and local officers. Violations are assigned severity weights from one to ten, multiplied by a time factor (violations in the past six months count double), normalized by the carrier’s size or inspection volume, and finally converted into a percentile that compares each carrier to its peers. Shippers and brokers rarely log into the FMCSA portal themselves; instead they pay third-party monitoring services—Carrier411, SaferWatch, RMIS, Tenstreet, Highway—that scrape the SMS data nightly, overlay their own alerts and grading algorithms, and sell the packaged result back to the industry as a turnkey vetting tool.
The system looks rigorous at first blush, but the underlying data has major integrity issues.
Take driver integrity as an example. The explosion of CDL mills and identity fraud since 2020 means a growing number of violations are being written to fake or borrowed license numbers that never match the driver actually behind the wheel. When an inspector scans a fraudulent CDL, the violation still lands on the carrier’s USDOT number, but the driver-level accountability evaporates.
Hours-of-service enforcement faces an even darker problem: a cottage industry of black-market ELD providers and “edited” log apps now sells drivers unlimited extra hours for as little as $50 a week. Carriers who play by the rules watch their HOS BASIC climb because their honest logs show fatigue, while fleets using shady ELDs slip through inspections with pristine electronic records that bear no resemblance to reality. The FMCSA has allowed ELD providers to self-certify and only recently has started cracking down on the fraudulent providers.
These integrity gaps were serious enough on their own, but in April 2022 the FMCSA delivered what many carriers cheered as a long-overdue correction and what most safety advocates saw as a catastrophic mistake: it removed the Crash Indicator percentile from public view. The agency cited studies showing that roughly 80 percent of truck-involved crashes are caused by the four-wheeler, not the professional driver, and argued that displaying a crash percentile unfairly penalized carriers for events outside their control. Overnight, the one objective outcome measure in the entire CSA program vanished from the dashboards that shippers and brokers actually use. In its place we now have only process measures—violations caught during the tiny fraction of miles when an inspector happens to pull a truck over.
The result is that broker and shipper scorecards today lean ever more heavily on the very inspection-derived BASICs that are most vulnerable to gaming and fraud. A carrier can have a spotless Unsafe Driving score, a glowing Vehicle Maintenance percentile, and still be racking up preventable fatalities every quarter—because none of those deaths show up anywhere the brokerage can see. The underlying data’s low quality is why technology companies focused on carrier identity, like Highway, have to apply so much of their own engineering and artificial intelligence to these scores.
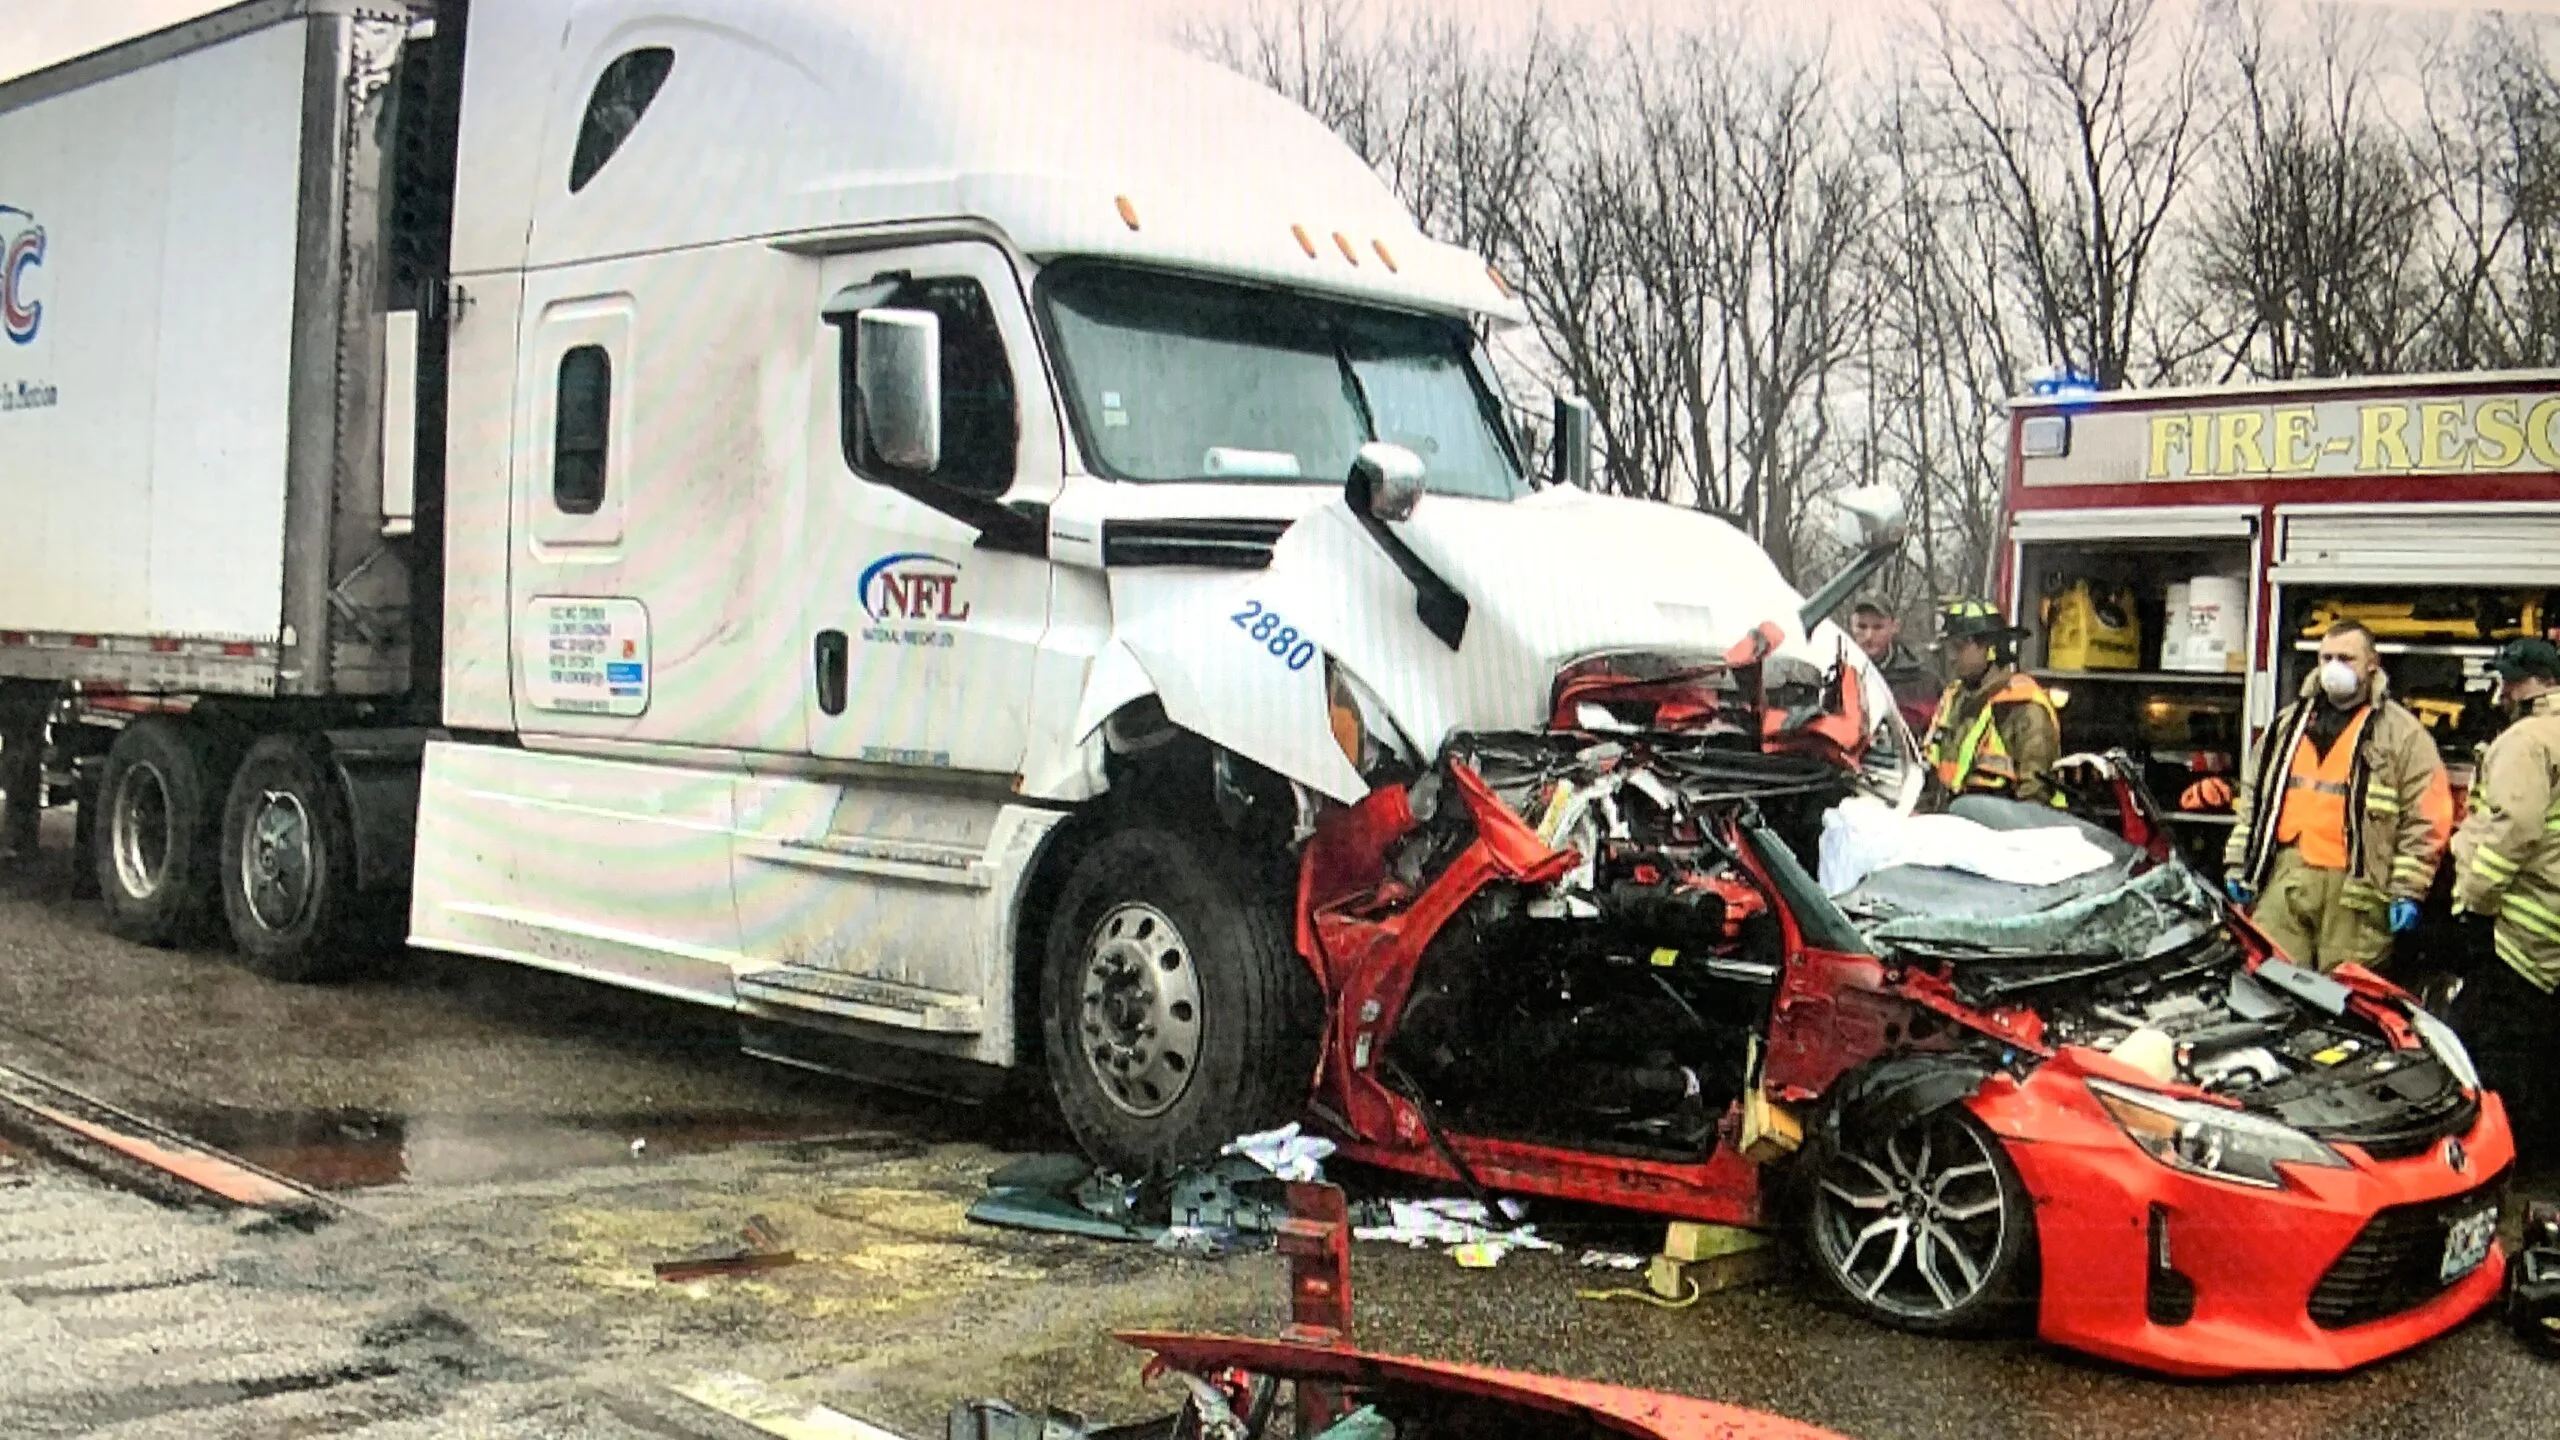
That brings us to the data source the FMCSA still has, still updates monthly, and still won’t integrate into public carrier vetting: the MCMIS crash file. Every reportable commercial-vehicle crash, defined as any incident involving a fatality, an injury treated away from the scene, or a tow-away, must be uploaded by the states within 90 days. The file contains the carrier’s USDOT number, date, location, fatality count, injury count, tow-away flag, and whether hazmat was released. There is no assignment of fault, no police report-style narrative, no photos—but also no reliance on whether an inspector happened to catch a burned-out bulb six months earlier. It is raw outcome data, warts and all.
Yes, the crash file is incomplete. The U.S. Government Accountability Office estimates national under-reporting at approximately 30 to 40 percent, with wide variation by state. Another limitation of crash data is that it includes many incidents the truck driver genuinely could not have avoided. But those same limitations applied when the Crash Indicator percentile was public, and the industry still treated it as the single most important number on the page. The difference now is that shippers and brokers have been deliberately blinded to the only hard outcome metric available at a national scale.
The FMCSA’s own Crash Preventability Determination Program already proves the agency can distinguish preventable from non-preventable crashes when dashcam footage or police reports are submitted. As of 2025, sixteen crash types—from being rear-ended while stopped to suicides in front of the truck—are eligible for removal from a carrier’s internal Crash Indicator score. If the agency can make those determinations for enforcement prioritization, it can certainly publish a simple “preventable crash rate” alongside the inspection-based BASICs.
Until that happens, shippers and brokers who care about actual safety outcomes and not just the appearance of compliance on inspection day essentially have one option: download the monthly MCMIS crash file themselves, filter for the past 24 months, normalize by power-unit count or miles traveled when available, and layer that on top of the superficially enlightening but increasingly gamed CSA percentiles they get from monitoring services. It’s a little bit of extra data wrangling, but the alternative is pretending that a system built on semi-random roadside inspections and vulnerable to widespread fraud is the best we can do.
When you think about it, judging a carrier’s quality on how it performs during the artificial situation of a roadside inspection, just a few minutes, is clearly inferior to using objective crash data that captures the carrier’s performance when its trucks are actually operating and driving down the highway next to American families.
At a time when broker liability is going to the U.S. Supreme Court, buyers of trucking capacity should be able to easily access accurate, fast, multi-dimensional crash data to integrate into their carrier quality evaluations. The FMCSA can make this happen.
This is the first story in a multi-story series on trucking carrier safety.
The post Commentary: the trucking industry needs better crash data appeared first on FreightWaves.


