
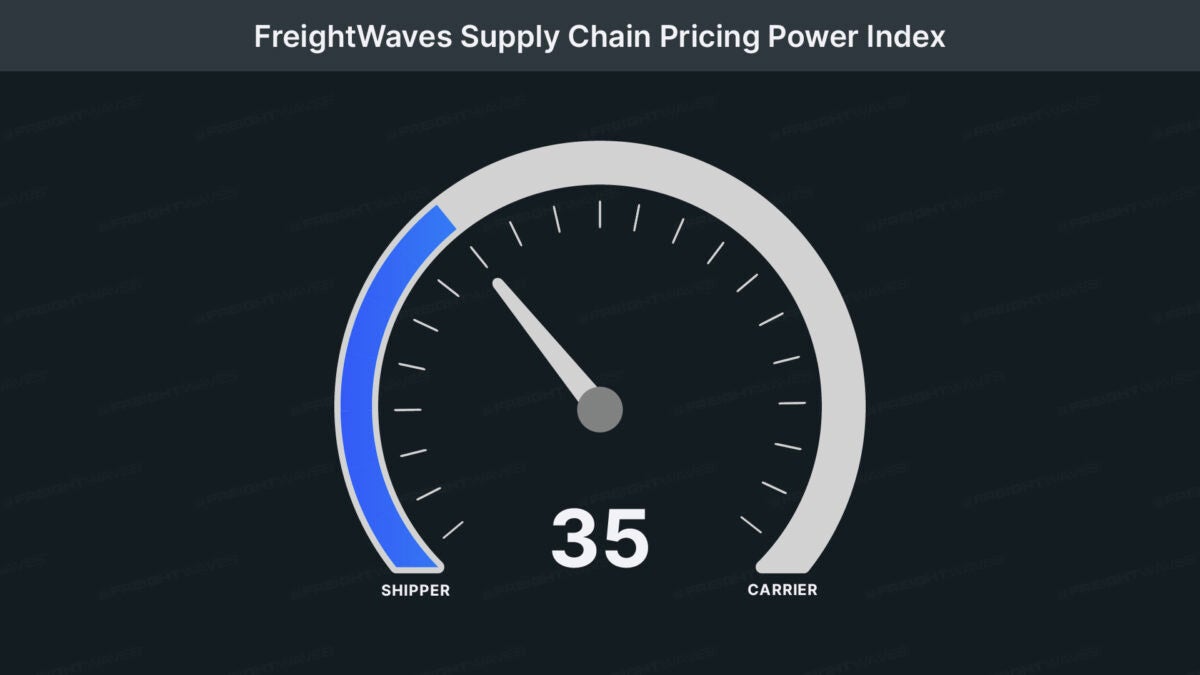
This week’s FreightWaves Supply Chain Pricing Power Index: 35 (Shippers)
Last week’s FreightWaves Supply Chain Pricing Power Index: 35 (Shippers)
Three-month FreightWaves Supply Chain Pricing Power Index Outlook: 40 (Shippers)
The FreightWaves Supply Chain Pricing Power Index uses the analytics and data in FreightWaves SONAR to analyze the market and estimate the negotiating power for rates between shippers and carriers.
This week’s Pricing Power Index is based on the following indicators:
Tender volumes remain under pressure
The International Longshoremen’s Association strike was shorter than many anticipated, lasting just three days, when some of the largest retailers were expecting the terminal closures to last at least a week. Now, even though the strike was shorter than many expected, volume levels across domestic modes were lower to start October.
To learn more about FreightWaves SONAR, click here.
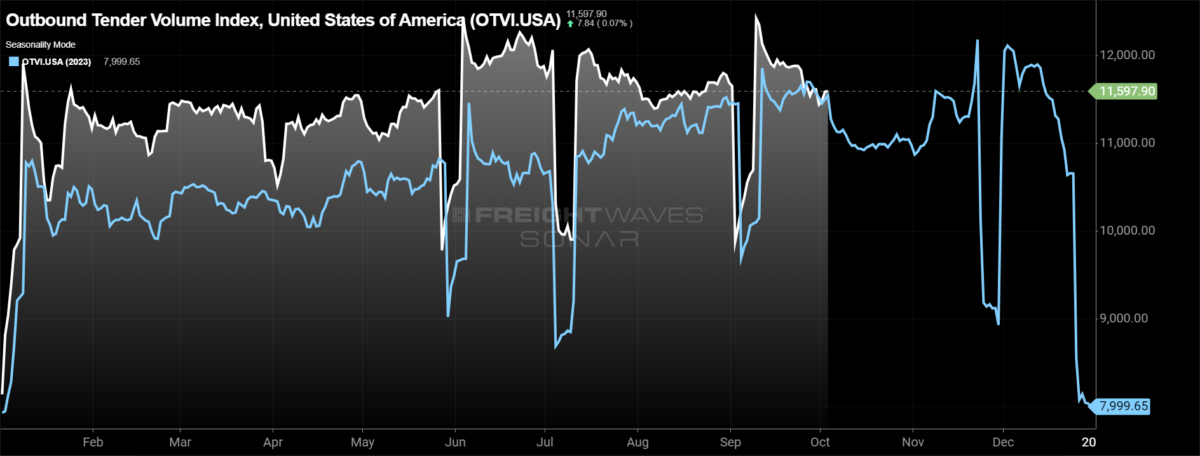
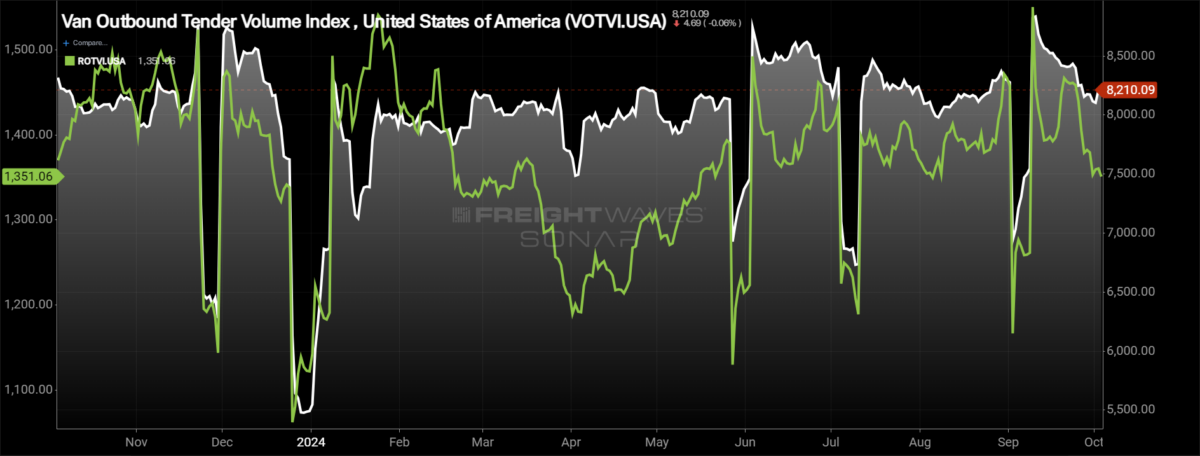
The Outbound Tender Volume Index (OTVI), a measure of national freight demand that tracks shippers’ requests for trucking capacity, is down 0.43% week over week, the third consecutive weekly decline. The OTVI turned negative year over year to start the month but has since turned positive again. At present, the OTVI is 3.63% higher year over year.
To learn more about FreightWaves SONAR, click here.
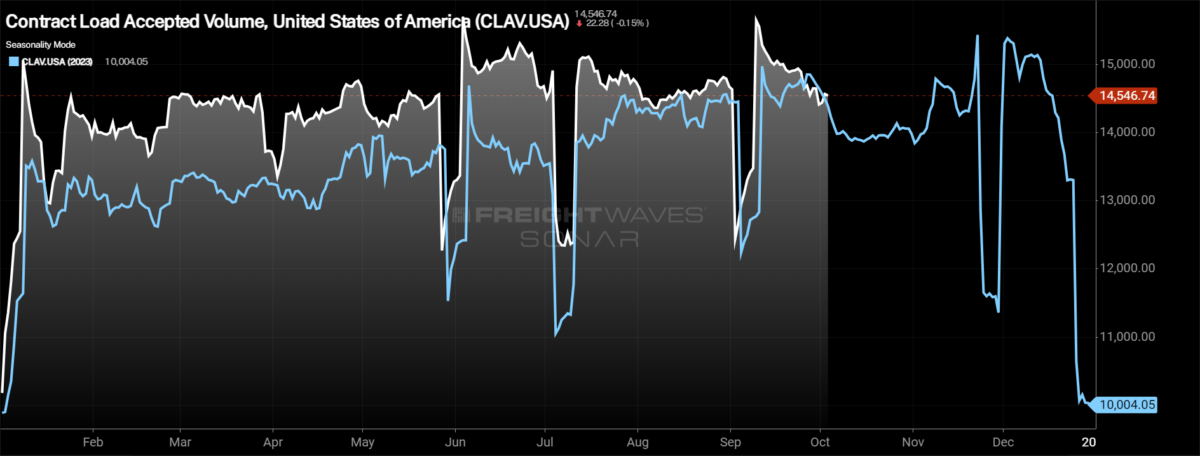
Contract Load Accepted Volume (CLAV) is an index that measures accepted load volumes moving under contracted agreements. In short, it is similar to OTVI but without the rejected tenders. Looking at accepted tender volumes, we see a decrease of 1.02% w/w. The larger decrease than the overall OTVI is driven by tender rejection rates moving higher over the past week.
Bank of America’s recent credit and debit card spending report shows that spending is barely higher in September. In the most recent report, for the week ending Sept. 28, total card spending was up 0.3% year over year. Spending across the discretionary categories was lower, significantly so when looking at online electronics and furniture, which fell 13% and 7% y/y, respectively.
To learn more about FreightWaves SONAR, click here.
As the overall market continues to see volume levels retreat from the Labor Day highs, the vast majority of the markets in the country are reporting lower volumes on a week-over-week basis. Of the 135 freight markets tracked within FreightWaves SONAR, 59 experienced higher volumes compared to last week, down from 63 in the week prior.
The markets that are experiencing volume growth have largely been the smaller freight markets, so any uptick in volume looks more significant than it is to the overall market. This week, there is an exception to that growth story, though. The Joliet, Illinois, market, which neighbors Chicago and is one of the largest markets in the country, saw volumes grow by 4.79% w/w.
In the port markets directly affected by the ILA strike, volumes largely fell. In Houston, outbound volumes fell by 4.61% w/w. In Elizabeth, New Jersey, volumes dropped by 13.52% w/w. In Baltimore, volumes were down 8.74%. With the terminals reopening Friday and port workers returning to work, it will help return volume to these markets, but it will take time to clear the queues that were starting to build, so it could be a longer build back than an immediate turning on of the faucet.
To learn more about FreightWaves SONAR, click here.
By mode: The dry van market experienced continued slowdown in volumes over the past week. The Van Outbound Tender Volume Index fell by 0.54% over the past week. With the move lower over the past week, dry van volumes are now lower on a year-over-year basis, currently down 0.2%.
The reefer market saw volumes continue to move significantly lower over the past week, falling to the lowest levels since late May. The Reefer Outbound Tender Volume Index fell by 3.85%, one of the most severe weekly declines outside of the holiday-affected weeks. After briefly turning positive y/y at the end of September, reefer volumes are now 2.14% lower y/y.
Rejection rates now higher than they were around Labor Day
The strike impacts on capacity have been minimal, but rejection rates have moved higher this week after ending September on a sour note. Even with the movement higher, rejection rates remain below 5%. The slight volatility this week was a positive sign for the market, hopefully setting the stage for some positive signs in the back half of the fourth quarter.
To learn more about FreightWaves SONAR, click here.
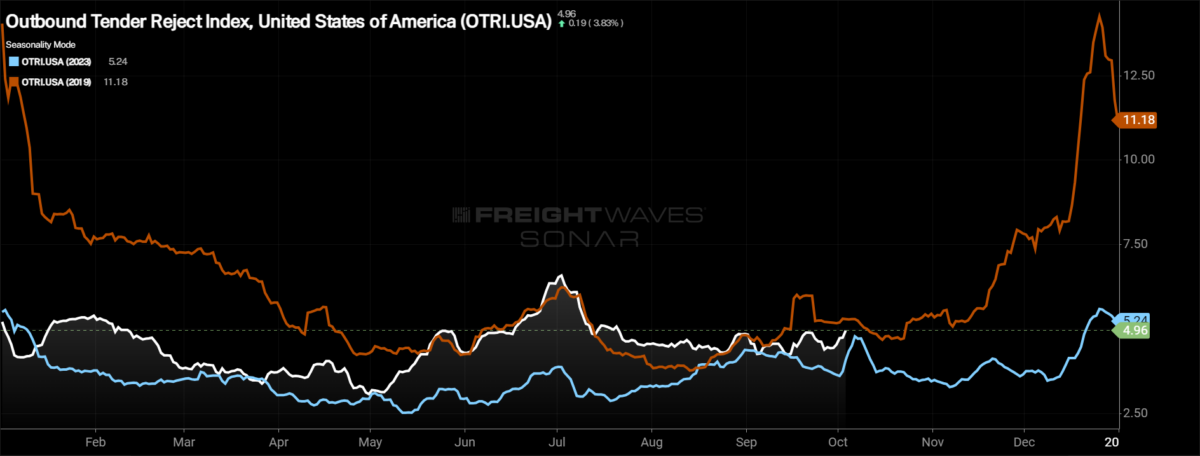
Over the past week, the Outbound Tender Reject Index (OTRI), a measure of relative capacity, increased by 56 basis points to 4.96%, reversing course and moving higher than Labor Day levels. The OTRI is now 45 basis points above last year’s levels, a signal that while it doesn’t feel tighter because rejection rates are still below 5%, rejection rates are higher in aggregate. Rejection rates are moving back toward 2019 levels, now just 34 basis points below where they were at this time in 2019, compared to the 82 bps below 2019 they were this time last week.
To learn more about FreightWaves SONAR, click here.
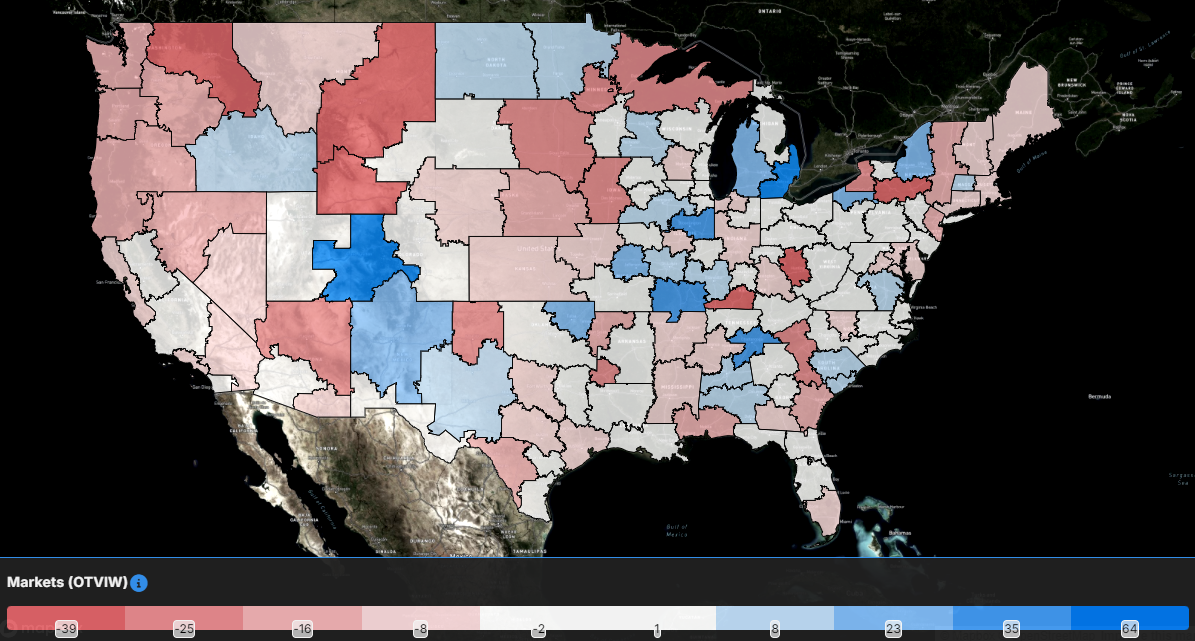
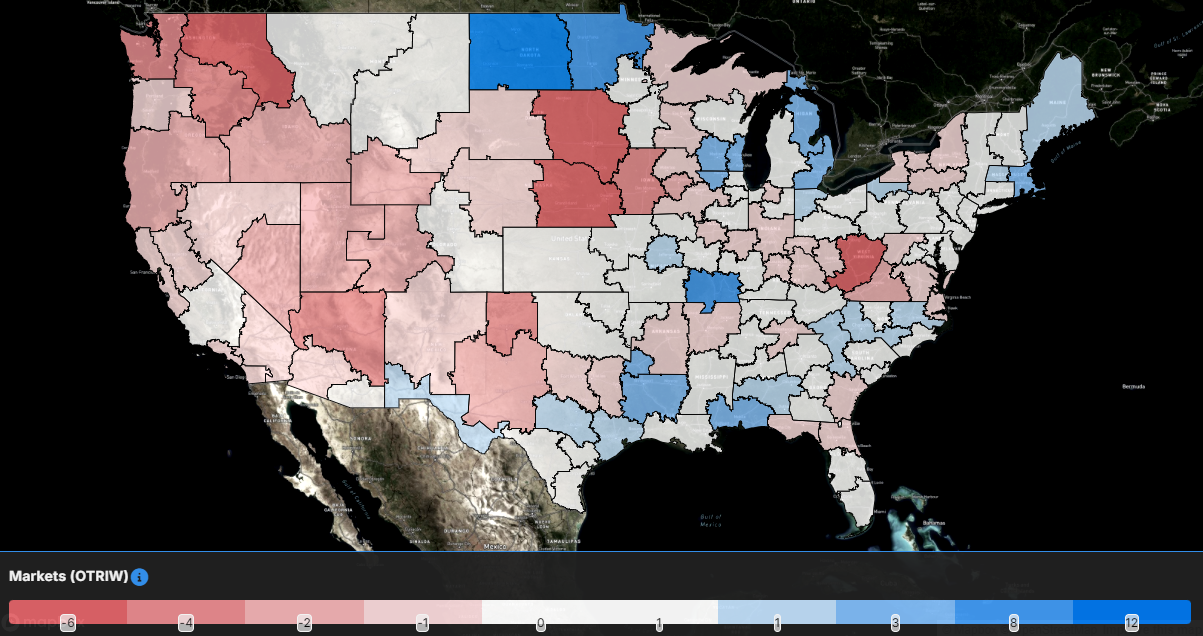
The map above shows the Outbound Tender Reject Index — Weekly Change for the 135 markets across the country. Markets shaded in blue are those where tender rejection rates have increased over the past week, whereas those in red have seen rejection rates decline. The bolder the color, the more significant the change.
Of the 135 markets, just 78 reported higher rejection rates over the past week, a significant increase from 40 in last week’s report.
The largest increases in the country continue to be the smaller freight markets by outbound volumes, including Bismarck and Fargo, North Dakota, where rejection rates increased by 1,208 bps and 800 bps, respectively. Given the size of the freight market, these increases aren’t that impactful to the overall freight market.
The most significant changes in rejection rates are happening in larger markets like Chicago and Atlanta. Over the past week, rejection rates in Atlanta have increased by 76 bps, but the overall rejection rate in the market remains depressed at 3.6%. In Chicago, tender rejection rates increased by 89 bps over the past week, eclipsing the 5% level at 5.08%.
To learn more about FreightWaves SONAR, click here.
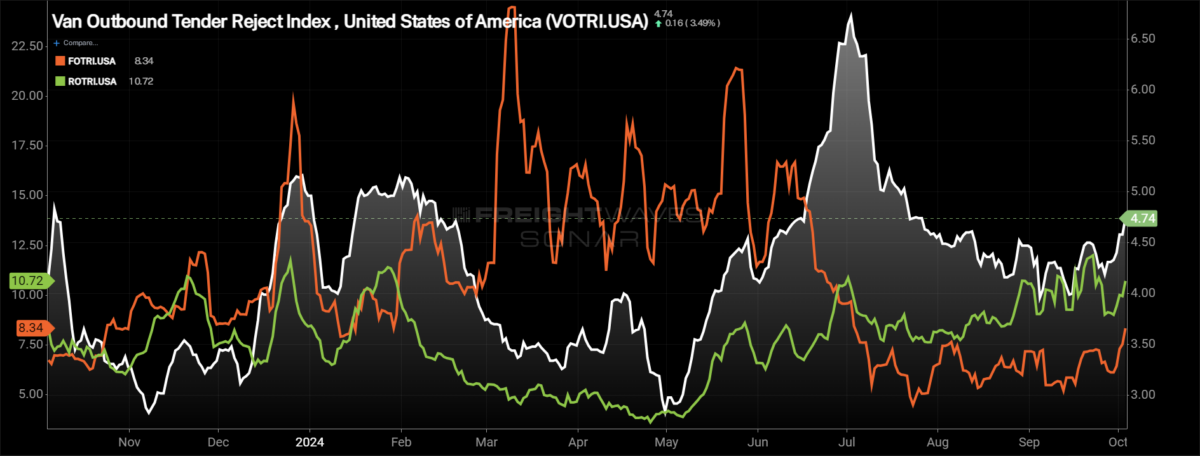
By mode: All of the equipment types in the truckload market saw rejection rates move higher this week. The dry van market experienced the smallest increase in rejection rates of the various equipment types, which makes sense given it is the largest equipment type. The Van Outbound Tender Reject Index rose 55 basis points over the past week to 4.74%, up 30 bps from this time last year.
The reefer market has seen rejection rates climb back above the 10% level, an important level for the overall market. Over the past week, the Reefer Outbound Tender Reject Index increased by 169 bps to 10.72%. Reefer rejection rates are 320 basis points above where they were this time last year.
The flatbed market continues to shake off the challenging summer months as rejection rates have moved higher overall since the announcement of the initial interest rate cut. Additionally, the damage in the Southeast caused by Hurricane Helene will create more project freight opportunities as communities start rebuilding. The Flatbed Outbound Tender Reject Index increased by 168 bps over the past week to 8.34%. Flatbed rejection rates are now 179 bps above where they were last year.
Spot rates rebound to kick off the fourth quarter
With rejection rates moving slightly higher over the past week and challenges in the Southeast with sections of Interstates 26 and 40 shut down for prolonged periods, spot rates inched higher to kick off the fourth quarter.
To learn more about FreightWaves SONAR, click here.
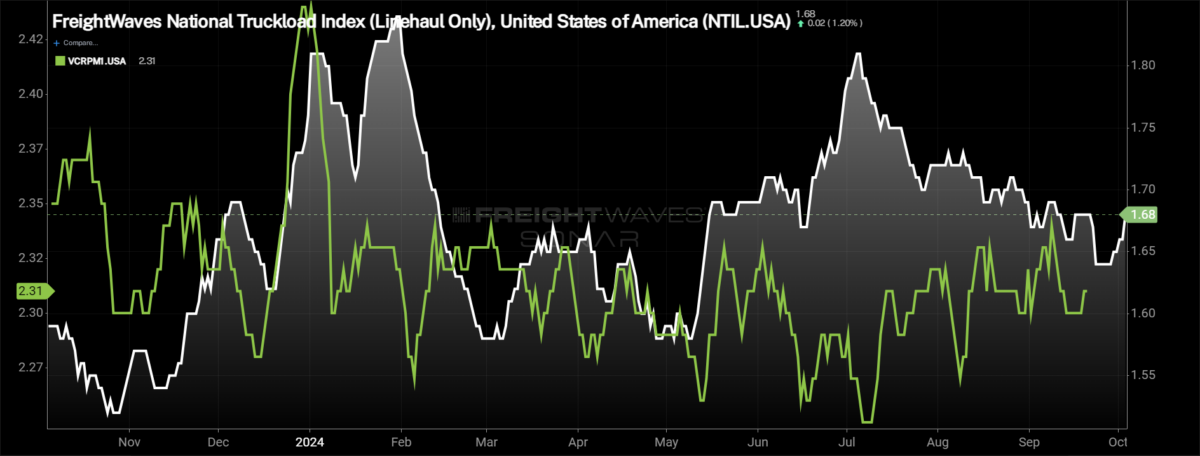
This week, the National Truckload Index — which includes fuel surcharge and various accessorials — recouped some of last week’s losses, rising 3 cents per mile to $2.23. The NTI is now 6 cents per mile or 2.6% lower than it was at this time last year. The increase in the linehaul variant of the NTI (NTIL) — which excludes fuel surcharges and other accessorials — was even more impressive, rising by 4 cents per mile to $1.68, erasing all of last week’s decline. The NTIL is 9 cents per mile higher than it was at this time last year. The discrepancy in the NTIL and NTI is solely the changes in fuel, which was far more expensive in 2023 than currently. The average diesel truck spot price per gallon is 96 cents, or 21%, lower than it was last year.
Initially reported dry van contract rates have stayed in a fairly tight range, remaining stable over the past week at $2.31 per mile. Throughout 2024, contract rates have been in a tight range, an indication that the extreme cost savings are in the rearview mirror and service is now coming to the forefront. Initially reported contract rates are down 7 cents per mile from this time last year, a 2.9% decline.
To learn more about FreightWaves SONAR, click here.
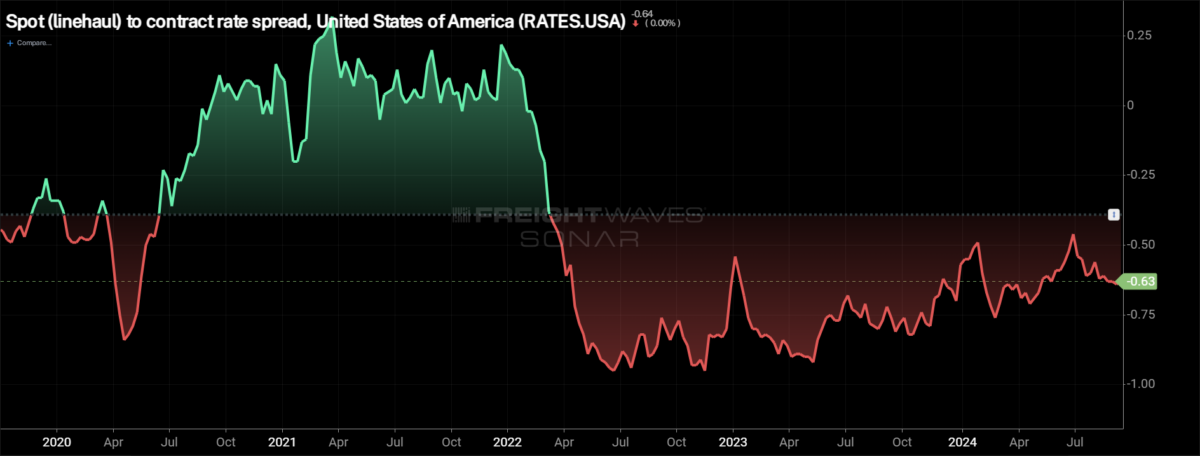
The chart above shows the spread between the NTIL and dry van contract rates is trending back to pre-pandemic levels. The spread remains historically wide and has actually widened in recent weeks, diverting from the pre-pandemic average that it had been inching closer to throughout the year. Significant disruptions can quickly tighten the spread as spot rates react much faster, so seeing a narrowing of the spread in the fourth quarter, during truckload peak season, wouldn’t be a surprise. The question is how significant the narrowing is and whether it is sustainable, especially if the first quarter of 2025 is the traditionally soft period for freight demand.
To learn more about FreightWaves TRAC, click here.
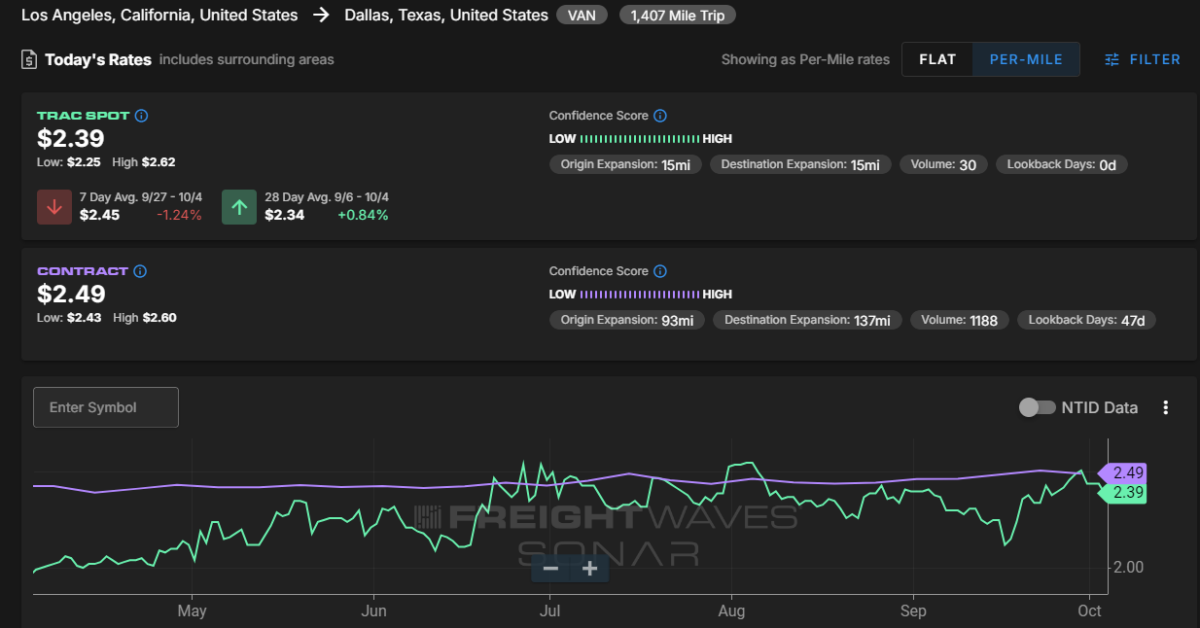
The FreightWaves Trusted Rate Assessment Consortium spot rate from Los Angeles to Dallas fell slightly over the past week but in a significant way. The TRAC rate from Los Angeles to Dallas decreased by 3 cents per mile to $2.39. Spot rates along this lane are now just 10 cents per mile below the contract rate.
To learn more about FreightWaves TRAC, click here.
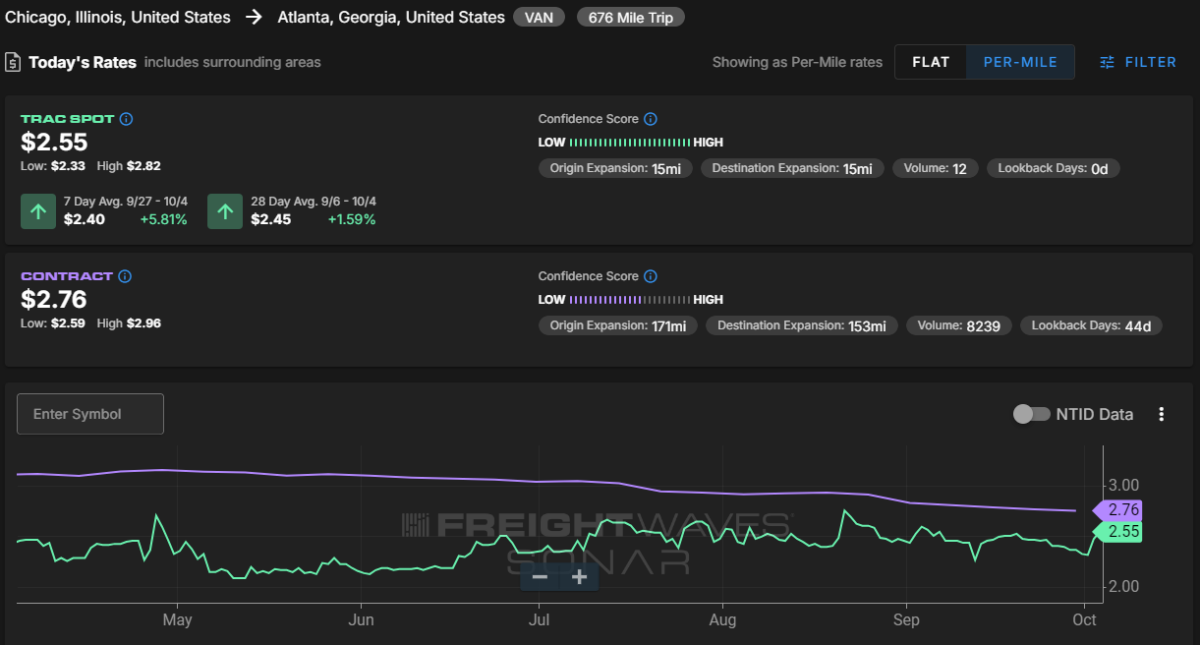
From Chicago to Atlanta, spot rates rebounded to start October. The FreightWaves TRAC spot rate along this lane rose 14 cents per mile to $2.55, now 21 cents per mile below the contract rate.
The post A slight rebound to start the fourth quarter appeared first on FreightWaves.


